# 跨標的與多時間框架
`request.security()` 在不同標的和/或時間框架的上下文中對表達式求值,並將結果對齊到當前圖表 bar。它是 Navi 中存取多時間框架(MTF)資料和其他標的資料的主要方式。
## 基本語法
```navi
request.security(symbol, timeframe, expression, gaps, lookahead, ignore_invalid_symbol, currency, calc_bars_count)
```
| 參數 | 類型 | 說明 |
|---|---|---|
| `symbol` | `string` | 標的識別符,如 `"NASDAQ:AAPL"` 或 `syminfo.tickerid` |
| `timeframe` | `string` | 時間框架字串,如 `"D"`、`"W"`、`"60"` |
| `expression` | 任意 series | 在請求的標的/時間框架上求值的表達式 |
| `gaps` | `BarmergeGaps` | `BarmergeGaps.Off`(預設):延續最後值;`BarmergeGaps.On`:無新值時發出 `na` |
| `lookahead` | `BarmergeLookahead` | `BarmergeLookahead.Off`(預設)或 `BarmergeLookahead.On` |
| `ignore_invalid_symbol` | `bool` | 若為 `true`,未知標的返回 `na` 而不報錯 |
| `currency` | `string` | 價格轉換的目標貨幣 |
| `calc_bars_count` | `int` | 可選的正整數,用於限制請求流載入的最近歷史視窗大小 |
## 基礎示例
### 高時間框架收盤價
```navi
indicator("日線圖上的週線收盤價", overlay: true);
let weekly_close = request.security(syminfo.tickerid, "W", close);
plot(weekly_close, "週線收盤", color: color.BLUE);
```
### 其他標的
```navi
indicator("AAPL 圖上的 SPY", overlay: false);
let spy_close = request.security("AMEX:SPY", "D", close);
plot(spy_close);
```
### 高時間框架指標
```navi
indicator("週線 RSI");
let weekly_rsi = request.security(syminfo.tickerid, "W", ta.rsi(close, 14));
plot(weekly_rsi);
hline(70);
hline(30);
```
## 時間框架字串
| 字串 | 含義 |
|---|---|
| `"1"`、`"5"`、`"15"`、`"60"` | 分鐘 |
| `"D"` | 日線 |
| `"W"` | 週線 |
| `"M"` | 月線 |
| `"3M"`、`"6M"` | 多月 |
使用 `timeframe.period` 引用圖表自身的時間框架。
## `calc_bars_count`
當請求只需要最近一小段歷史時,可以使用 `calc_bars_count`。
- 傳入正整數後,provider 最多為該請求流載入這麼多最近 bar。
- `na` 表示不設定上限。
```navi
let recent_weekly = request.security(syminfo.tickerid, "W", close, calc_bars_count: 2);
```
## gaps(空缺填充)
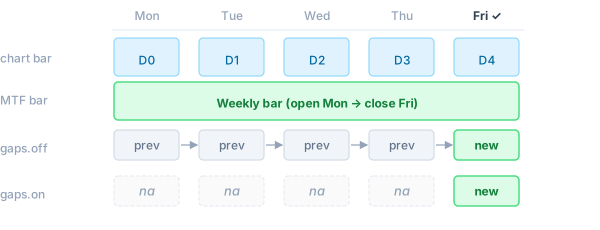
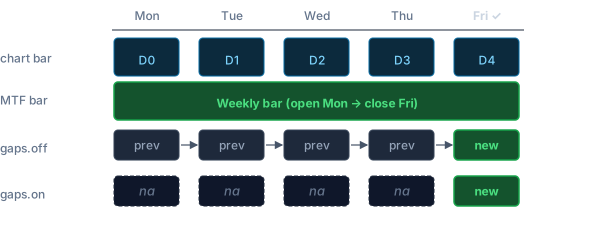
當請求的時間框架高於圖表時間框架時,高時間框架 bar 收盤的頻率低於圖表 bar 推進的頻率。
- **`BarmergeGaps.Off`**(預設):最後已知值向前延續——序列中不會出現 `na`。
- **`BarmergeGaps.On`**:每個高時間框架 bar 尚未收盤的圖表 bar 都會發出 `na`。
 ```navi
// Off(預設):weekly_close 始終有值
let weekly_close = request.security(syminfo.tickerid, "W", close);
// On:除週五(週線 bar 收盤)外的所有交易日均為 na
let weekly_close_gaps = request.security(syminfo.tickerid, "W", close, gaps: BarmergeGaps.On);
```
## lookahead(超前讀取)
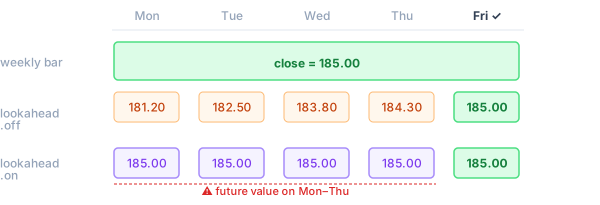
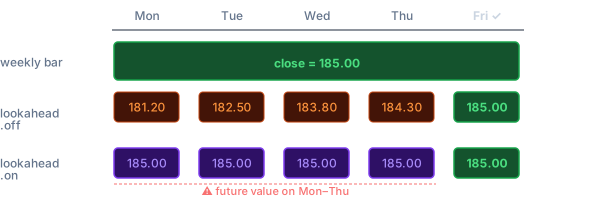
`BarmergeLookahead.On` 使表達式在週期內的第一個圖表 bar 就能看到高時間框架 bar 的**最終值**,而不是正在形成中的值。這會在歷史 bar 中引入未來資料洩漏——僅在明確需要時使用。
```navi
// Off(預設):weekly_close 始終有值
let weekly_close = request.security(syminfo.tickerid, "W", close);
// On:除週五(週線 bar 收盤)外的所有交易日均為 na
let weekly_close_gaps = request.security(syminfo.tickerid, "W", close, gaps: BarmergeGaps.On);
```
## lookahead(超前讀取)
`BarmergeLookahead.On` 使表達式在週期內的第一個圖表 bar 就能看到高時間框架 bar 的**最終值**,而不是正在形成中的值。這會在歷史 bar 中引入未來資料洩漏——僅在明確需要時使用。
 ```navi
// 預設:看到正在形成的週線開盤價(本週內持續更新)
let weekly_open = request.security(syminfo.tickerid, "W", open);
// 使用 lookahead:週一即可看到已確認的週線開盤價
let weekly_open_confirmed = request.security(syminfo.tickerid, "W", open, lookahead: BarmergeLookahead.On);
```
## `var` 和 `varip` 變量
`var` 和 `varip` 變量需在腳本頂層宣告,不能在 `expression` 參數內部宣告。子實例會在請求的標的/時間框架上執行完整程式體,因此頂層的 `var` 狀態會在**請求的**時間框架的各個 bar 之間獨立累積:
```navi
indicator("累計成交量(週線)");
// 在頂層宣告——子實例在週線 bar 上累積此變量
var cum: float = 0.0;
cum += volume;
let weekly_cum_vol = request.security(syminfo.tickerid, "W", cum);
plot(weekly_cum_vol);
```
每個 `request.security` 呼叫點都有獨立的子實例——其 `var` 狀態與主腳本及其他 `request.security` 呼叫互相獨立。
## 元組
表達式可以以元組形式返回多個值:
```navi
indicator("週線 OHLC");
let (w_open, w_high, w_low, w_close) =
request.security(syminfo.tickerid, "W", (open, high, low, close));
plot_candle(w_open, w_high, w_low, w_close);
```
## `ignore_invalid_symbol`
當標的可能不存在於資料提供者中時使用此參數:
```navi
let price = request.security("SOME:SYMBOL", "D", close, ignore_invalid_symbol: true);
// 標的未識別時 price 為 na,不會觸發執行時錯誤
```
不使用此參數時,未識別的標的會觸發執行時錯誤並中止執行。
## `request.security_lower_tf`
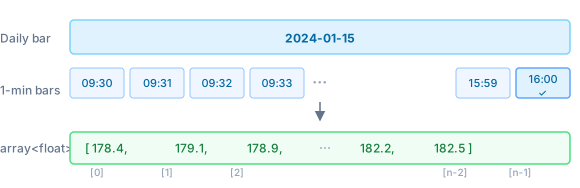
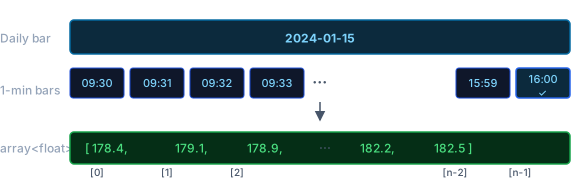
獲取低時間框架資料時,使用 `request.security_lower_tf`。它返回一個 `Array`,包含當前圖表 bar 內所有子 bar 的值,按升序排列:
```navi
// 預設:看到正在形成的週線開盤價(本週內持續更新)
let weekly_open = request.security(syminfo.tickerid, "W", open);
// 使用 lookahead:週一即可看到已確認的週線開盤價
let weekly_open_confirmed = request.security(syminfo.tickerid, "W", open, lookahead: BarmergeLookahead.On);
```
## `var` 和 `varip` 變量
`var` 和 `varip` 變量需在腳本頂層宣告,不能在 `expression` 參數內部宣告。子實例會在請求的標的/時間框架上執行完整程式體,因此頂層的 `var` 狀態會在**請求的**時間框架的各個 bar 之間獨立累積:
```navi
indicator("累計成交量(週線)");
// 在頂層宣告——子實例在週線 bar 上累積此變量
var cum: float = 0.0;
cum += volume;
let weekly_cum_vol = request.security(syminfo.tickerid, "W", cum);
plot(weekly_cum_vol);
```
每個 `request.security` 呼叫點都有獨立的子實例——其 `var` 狀態與主腳本及其他 `request.security` 呼叫互相獨立。
## 元組
表達式可以以元組形式返回多個值:
```navi
indicator("週線 OHLC");
let (w_open, w_high, w_low, w_close) =
request.security(syminfo.tickerid, "W", (open, high, low, close));
plot_candle(w_open, w_high, w_low, w_close);
```
## `ignore_invalid_symbol`
當標的可能不存在於資料提供者中時使用此參數:
```navi
let price = request.security("SOME:SYMBOL", "D", close, ignore_invalid_symbol: true);
// 標的未識別時 price 為 na,不會觸發執行時錯誤
```
不使用此參數時,未識別的標的會觸發執行時錯誤並中止執行。
## `request.security_lower_tf`
獲取低時間框架資料時,使用 `request.security_lower_tf`。它返回一個 `Array`,包含當前圖表 bar 內所有子 bar 的值,按升序排列:
 ```navi
indicator("日線圖上的分鐘級最高價");
// 返回每根日線 bar 內所有 1 分鐘 bar 的最高價
let minute_highs = request.security_lower_tf(syminfo.tickerid, "1", high);
// 當前日線 bar 內的最高 1 分鐘最高價
let intraday_high = minute_highs.max();
plot(intraday_high);
```
當某個 bar 內沒有子 bar 資料時,陣列為空(`minute_highs.size() == 0`)。
## Ticker 表達式
Ticker 表達式是一個將多個標的透過算術運算子組合的字串。Navi 會將其分解為獨立的 `DataProvider` 請求,逐 bar 對表達式求值,並將結果作為單一序列返回。
### 支援的運算子
| 運算子 | 示例 | 結果 |
|---|---|---|
| `*` | `"AAPL*2"` | 標的值 × 純量 |
| `/` | `"AAPL/SPY"` | 兩個標的的比值 |
| `+` | `"AAPL+MSFT"` | 兩個標的之和 |
| `-` | `"AAPL-MSFT"` | 兩個標的之差 |
運算元可以是標的字串(`"EXCHANGE:TICKER"`)或數字字面量。運算子優先順序與標準數學一致,必要時可使用括號。
### 示例
**加權組合(50/50 投資組合)**
```navi
let blend = request.security("NASDAQ:AAPL*0.5+AMEX:SPY*0.5", "D", close);
```
**相對表現(比值)**
```navi
// AAPL 相對於 SPY 的價格——買一股 AAPL 需要多少股 SPY?
let ratio = request.security("NASDAQ:AAPL/AMEX:SPY", "D", close);
plot(ratio);
```
**價差(差值)**
```navi
// 黃金/白銀價差
let spread = request.security("COMEX:GC1!/COMEX:SI1!", "D", close);
plot(spread);
```
**多標的等權指數**
```navi
// 四隻科技股等權平均
let tech = request.security(
"NASDAQ:AAPL*0.25+NASDAQ:MSFT*0.25+NASDAQ:GOOGL*0.25+NASDAQ:AMZN*0.25",
"D",
close
);
plot(tech);
```
### 執行原理
對於 `"AAPL*0.5+SPY*0.5"` 這樣的表達式,Navi 的處理步驟:
1. 提取各個標的(`AAPL`、`SPY`),透過 `DataProvider` 獲取對應的 K 線資料。
2. 每個 bar 上,使用各標的子實例中請求的 `expression` 欄位(如 `close`)對算術表達式求值。
3. 將計算得到的純量結果對齊到圖表 bar 後返回。
表達式中的每個標的都計入 `max_security_calls` 限制,與一般 `request.security` 呼叫相同。
## 限制
- **嵌套深度**:預設情況下,`request.security` 表達式內部最多可嵌套呼叫 `request.security` 3 層(可透過 `ExecutionLimits::max_security_depth` 配置)。
- **呼叫次數**:每個唯一的 `(symbol, timeframe)` 組合計入 `ExecutionLimits::max_security_calls`(預設 40)。
```navi
indicator("日線圖上的分鐘級最高價");
// 返回每根日線 bar 內所有 1 分鐘 bar 的最高價
let minute_highs = request.security_lower_tf(syminfo.tickerid, "1", high);
// 當前日線 bar 內的最高 1 分鐘最高價
let intraday_high = minute_highs.max();
plot(intraday_high);
```
當某個 bar 內沒有子 bar 資料時,陣列為空(`minute_highs.size() == 0`)。
## Ticker 表達式
Ticker 表達式是一個將多個標的透過算術運算子組合的字串。Navi 會將其分解為獨立的 `DataProvider` 請求,逐 bar 對表達式求值,並將結果作為單一序列返回。
### 支援的運算子
| 運算子 | 示例 | 結果 |
|---|---|---|
| `*` | `"AAPL*2"` | 標的值 × 純量 |
| `/` | `"AAPL/SPY"` | 兩個標的的比值 |
| `+` | `"AAPL+MSFT"` | 兩個標的之和 |
| `-` | `"AAPL-MSFT"` | 兩個標的之差 |
運算元可以是標的字串(`"EXCHANGE:TICKER"`)或數字字面量。運算子優先順序與標準數學一致,必要時可使用括號。
### 示例
**加權組合(50/50 投資組合)**
```navi
let blend = request.security("NASDAQ:AAPL*0.5+AMEX:SPY*0.5", "D", close);
```
**相對表現(比值)**
```navi
// AAPL 相對於 SPY 的價格——買一股 AAPL 需要多少股 SPY?
let ratio = request.security("NASDAQ:AAPL/AMEX:SPY", "D", close);
plot(ratio);
```
**價差(差值)**
```navi
// 黃金/白銀價差
let spread = request.security("COMEX:GC1!/COMEX:SI1!", "D", close);
plot(spread);
```
**多標的等權指數**
```navi
// 四隻科技股等權平均
let tech = request.security(
"NASDAQ:AAPL*0.25+NASDAQ:MSFT*0.25+NASDAQ:GOOGL*0.25+NASDAQ:AMZN*0.25",
"D",
close
);
plot(tech);
```
### 執行原理
對於 `"AAPL*0.5+SPY*0.5"` 這樣的表達式,Navi 的處理步驟:
1. 提取各個標的(`AAPL`、`SPY`),透過 `DataProvider` 獲取對應的 K 線資料。
2. 每個 bar 上,使用各標的子實例中請求的 `expression` 欄位(如 `close`)對算術表達式求值。
3. 將計算得到的純量結果對齊到圖表 bar 後返回。
表達式中的每個標的都計入 `max_security_calls` 限制,與一般 `request.security` 呼叫相同。
## 限制
- **嵌套深度**:預設情況下,`request.security` 表達式內部最多可嵌套呼叫 `request.security` 3 層(可透過 `ExecutionLimits::max_security_depth` 配置)。
- **呼叫次數**:每個唯一的 `(symbol, timeframe)` 組合計入 `ExecutionLimits::max_security_calls`(預設 40)。