, value: T)
```
Adds the specified `value` to the beginning of the given array.
**Parameters**
| Name | Type | Default | Description |
| --- | --- | --- | --- |
| `id` | Array<T> | | the array to modify. |
| `value` | T | | The value to add to the beginning. |
**See Also:** Array.shift
---
### variance {#variance}
Calculates the variance of the elements in the given `id`.
**Parameters**
| Name | Type | Default | Description |
| --- | --- | --- | --- |
| `id` |
Array<int> | | the input array of integers. |
| `biased` |
any | `true` | If `true`, the function uses biased estimation (dividing by `n`); if `false`, it uses unbiased estimation (dividing by `n-1`). |
**Returns:**
float
Calculates the variance of the elements in the given `id`.
**Parameters**
| Name | Type | Default | Description |
| --- | --- | --- | --- |
| `id` |
Array<float> | | the input array of floats. |
| `biased` |
any | `true` | If `true`, the function uses biased estimation (dividing by `n`); if `false`, it uses unbiased estimation (dividing by `n-1`). |
**Returns:**
float
Creates a new box object.
**Parameters**
| Name | Type | Default | Description |
| --- | --- | --- | --- |
| `left` |
series int | | The left coordinate (bar index or UNIX time). |
| `top` |
series float | | The top coordinate (price). |
| `right` |
series int | | The right coordinate (bar index or UNIX time). |
| `bottom` |
series float | | The bottom coordinate (price). |
| `border_color` |
series Color | `Color.BLUE` | The border color of the box. |
| `border_width` |
series int | `1` | The border width in pixels. |
| `border_style` |
series LineStyle | `LineStyle.Solid` | The border line style. |
| `extend` |
series Extend | `Extend.None` | The extension mode: Extend.None, Extend.Left, Extend.Right, or Extend.Both. |
| `xloc` |
series XLoc | `XLoc.BarIndex` | The x-location type: XLoc.BarIndex or XLoc.BarTime. |
| `bg_color` |
series Color | `Color.BLUE` | The background color of the box. |
| `text` |
series String | `na` | The text content of the box. |
| `text_size` |
series int | `0` | The text size in pixels. |
| `text_color` |
series Color | `Color.BLACK` | The text color. |
| `text_halign` |
series TextHAlign | `TextHAlign.Center` | The horizontal text alignment. |
| `text_valign` |
series TextVAlign | `TextVAlign.Center` | The vertical text alignment. |
| `text_wrap` |
series TextWrap | `TextWrap.None` | The text wrapping mode. |
| `text_font_family` |
series FontFamily | `FontFamily.Default` | The font family for the text. |
| `force_overlay` |
const bool | `false` | If true, the box is rendered on top. |
| `text_formatting` |
const TextFormat | `TextFormat.NONE` | The text formatting options. |
**Returns:**
series Box
Creates a new box object.
**Parameters**
| Name | Type | Default | Description |
| --- | --- | --- | --- |
| `left` |
series int | | The left coordinate (bar index or UNIX time). |
| `top` |
series float | | The top coordinate (price). |
| `right` |
series int | | The right coordinate (bar index or UNIX time). |
| `bottom` |
series float | | The bottom coordinate (price). |
| `border_color` |
series Color | `Color.BLUE` | The border color of the box. |
| `border_width` |
series int | `1` | The border width in pixels. |
| `border_style` |
series LineStyle | `LineStyle.Solid` | The border line style. |
| `extend` |
series Extend | `Extend.None` | The extension mode: Extend.None, Extend.Left, Extend.Right, or Extend.Both. |
| `xloc` |
series XLoc | `XLoc.BarIndex` | The x-location type: XLoc.BarIndex or XLoc.BarTime. |
| `bg_color` |
series Color | `Color.BLUE` | The background color of the box. |
| `text` |
series String | `na` | The text content of the box. |
| `text_size` |
series Size | `Size.Auto` | The text size as a named constant. |
| `text_color` |
series Color | `Color.BLACK` | The text color. |
| `text_halign` |
series TextHAlign | `TextHAlign.Center` | The horizontal text alignment. |
| `text_valign` |
series TextVAlign | `TextVAlign.Center` | The vertical text alignment. |
| `text_wrap` |
series TextWrap | `TextWrap.None` | The text wrapping mode. |
| `text_font_family` |
series FontFamily | `FontFamily.Default` | The font family for the text. |
| `force_overlay` |
const bool | `false` | If true, the box is rendered on top. |
| `text_formatting` |
const TextFormat | `TextFormat.NONE` | The text formatting options. |
**Returns:**
series Box
Creates a new box object.
**Parameters**
| Name | Type | Default | Description |
| --- | --- | --- | --- |
| `top_left` |
series chart.Point | | The
chart.Point object specifying the top-left corner. |
| `bottom_right` |
series chart.Point | | The
chart.Point object specifying the bottom-right corner. |
| `border_color` |
series Color | `Color.BLUE` | The border color of the box. |
| `border_width` |
series int | `1` | The border width in pixels. |
| `border_style` |
series LineStyle | `LineStyle.Solid` | The border line style. |
| `extend` |
series Extend | `Extend.None` | The extension mode: Extend.None, Extend.Left, Extend.Right, or Extend.Both. |
| `xloc` |
series XLoc | `XLoc.BarIndex` | The x-location type: XLoc.BarIndex or XLoc.BarTime. |
| `bg_color` |
series Color | `Color.BLUE` | The background color of the box. |
| `text` |
series String | `na` | The text content of the box. |
| `text_size` |
series Size | `Size.Auto` | The text size in pixels. |
| `text_color` |
series Color | `Color.BLACK` | The text color. |
| `text_halign` |
series TextHAlign | `TextHAlign.Center` | The horizontal text alignment. |
| `text_valign` |
series TextVAlign | `TextVAlign.Center` | The vertical text alignment. |
| `text_wrap` |
series TextWrap | `TextWrap.None` | The text wrapping mode. |
| `text_font_family` |
series FontFamily | `FontFamily.Default` | The font family for the text. |
| `force_overlay` |
const bool | `false` | If true, the box is rendered on top. |
| `text_formatting` |
const TextFormat | `TextFormat.NONE` | The text formatting options. |
**Returns:**
series Box
Creates a new box object.
**Parameters**
| Name | Type | Default | Description |
| --- | --- | --- | --- |
| `top_left` |
series chart.Point | | The
chart.Point object specifying the top-left corner. |
| `bottom_right` |
series chart.Point | | The
chart.Point object specifying the bottom-right corner. |
| `border_color` |
series Color | `Color.BLUE` | The border color of the box. |
| `border_width` |
series int | `1` | The border width in pixels. |
| `border_style` |
series LineStyle | `LineStyle.Solid` | The border line style. |
| `extend` |
series Extend | `Extend.None` | The extension mode: Extend.None, Extend.Left, Extend.Right, or Extend.Both. |
| `xloc` |
series XLoc | `XLoc.BarIndex` | The x-location type: XLoc.BarIndex or XLoc.BarTime. |
| `bg_color` |
series Color | `Color.BLUE` | The background color of the box. |
| `text` |
series String | `na` | The text content of the box. |
| `text_size` |
series Size | `Size.Auto` | The text size as a named constant. |
| `text_color` |
series Color | `Color.BLACK` | The text color. |
| `text_halign` |
series TextHAlign | `TextHAlign.Center` | The horizontal text alignment. |
| `text_valign` |
series TextVAlign | `TextVAlign.Center` | The vertical text alignment. |
| `text_wrap` |
series TextWrap | `TextWrap.None` | The text wrapping mode. |
| `text_font_family` |
series FontFamily | `FontFamily.Default` | The font family for the text. |
| `force_overlay` |
const bool | `false` | If true, the box is rendered on top. |
| `text_formatting` |
const TextFormat | `TextFormat.NONE` | The text formatting options. |
**Returns:**
series Box
series Array<Box>
Returns an array filled with all the current boxes drawn by the script.
## Methods
### copy {#copy}
```navi
copy(id: series Box): series Box
```
Creates a copy of the specified box and returns its id.
**Parameters**
| Name | Type | Default | Description |
| --- | --- | --- | --- |
| `id` | series Box | | The box to copy. |
**Returns:** series Box
---
### delete {#delete}
```navi
delete(id: series Box)
```
Deletes the specified box from the chart.
**Parameters**
| Name | Type | Default | Description |
| --- | --- | --- | --- |
| `id` | series Box | | The box to delete. |
---
### get_bottom {#get_bottom}
```navi
get_bottom(id: series Box): series float
```
Returns the price value of the bottom border of the box.
**Parameters**
| Name | Type | Default | Description |
| --- | --- | --- | --- |
| `id` | series Box | | The box to get the bottom coordinate from. |
**Returns:** series float
---
### get_left {#get_left}
```navi
get_left(id: series Box): series int
```
Returns the bar index or the UNIX time (depending on the last value used for 'xloc') of the left border of the box.
**Parameters**
| Name | Type | Default | Description |
| --- | --- | --- | --- |
| `id` | series Box | | The box to get the left coordinate from. |
**Returns:** series int
---
### get_right {#get_right}
```navi
get_right(id: series Box): series int
```
Returns the bar index or the UNIX time (depending on the last value used for 'xloc') of the right border of the box.
**Parameters**
| Name | Type | Default | Description |
| --- | --- | --- | --- |
| `id` | series Box | | The box to get the right coordinate from. |
**Returns:** series int
---
### get_top {#get_top}
```navi
get_top(id: series Box): series float
```
Returns the price value of the top border of the box.
**Parameters**
| Name | Type | Default | Description |
| --- | --- | --- | --- |
| `id` | series Box | | The box to get the top coordinate from. |
**Returns:** series float
---
### set_bg_color {#set_bg_color}
```navi
set_bg_color(id: series Box, color: series Color)
```
Sets the background color of the box.
**Parameters**
| Name | Type | Default | Description |
| --- | --- | --- | --- |
| `id` | series Box | | The box to modify. |
| `color` | series Color | | The new background color. |
---
### set_border_color {#set_border_color}
```navi
set_border_color(id: series Box, color: series Color)
```
Sets the border color of the box.
**Parameters**
| Name | Type | Default | Description |
| --- | --- | --- | --- |
| `id` | series Box | | The box to modify. |
| `color` | series Color | | The new border color. |
---
### set_border_style {#set_border_style}
```navi
set_border_style(id: series Box, style: series LineStyle)
```
Sets the border style of the box.
**Parameters**
| Name | Type | Default | Description |
| --- | --- | --- | --- |
| `id` | series Box | | The box to modify. |
| `style` | series LineStyle | | The new border line style. |
---
### set_border_width {#set_border_width}
```navi
set_border_width(id: series Box, width: series int)
```
Sets the border width of the box.
**Parameters**
| Name | Type | Default | Description |
| --- | --- | --- | --- |
| `id` | series Box | | The box to modify. |
| `width` | series int | | The new border width in pixels. |
---
### set_bottom {#set_bottom}
```navi
set_bottom(id: series Box, bottom: series float)
```
Sets the bottom coordinate of the box.
**Parameters**
| Name | Type | Default | Description |
| --- | --- | --- | --- |
| `id` | series Box | | The box to modify. |
| `bottom` | series float | | The new bottom coordinate (price). |
---
### set_bottom_right_point {#set_bottom_right_point}
```navi
set_bottom_right_point(id: series Box, point: series chart.Point)
```
Sets the bottom-right corner of the box using a `chart.Point` object.
**Parameters**
| Name | Type | Default | Description |
| --- | --- | --- | --- |
| `id` | series Box | | The box to modify. |
| `point` | series chart.Point | | The `chart.Point` object specifying the new bottom-right corner. |
---
### set_extend {#set_extend}
```navi
set_extend(id: series Box, extend: series Extend)
```
Sets extending type of the border of this box object.
**Parameters**
| Name | Type | Default | Description |
| --- | --- | --- | --- |
| `id` | series Box | | The box to modify. |
| `extend` | series Extend | | The extension mode: Extend.None, Extend.Left, Extend.Right, or Extend.Both. |
---
### set_left {#set_left}
```navi
set_left(id: series Box, left: series int)
```
Sets the left coordinate of the box.
**Parameters**
| Name | Type | Default | Description |
| --- | --- | --- | --- |
| `id` | series Box | | The box to modify. |
| `left` | series int | | The new left coordinate (bar index or UNIX time). |
---
### set_left_top {#set_left_top}
```navi
set_left_top(id: series Box, left: series int, top: series float)
```
Sets the left and top coordinates of the box.
**Parameters**
| Name | Type | Default | Description |
| --- | --- | --- | --- |
| `id` | series Box | | The box to modify. |
| `left` | series int | | The new left coordinate (bar index or UNIX time). |
| `top` | series float | | The new top coordinate (price). |
---
### set_right {#set_right}
```navi
set_right(id: series Box, right: series int)
```
Sets the right coordinate of the box.
**Parameters**
| Name | Type | Default | Description |
| --- | --- | --- | --- |
| `id` | series Box | | The box to modify. |
| `right` | series int | | The new right coordinate (bar index or UNIX time). |
---
### set_right_bottom {#set_right_bottom}
```navi
set_right_bottom(id: series Box, right: series int, bottom: series float)
```
Sets the right and bottom coordinates of the box.
**Parameters**
| Name | Type | Default | Description |
| --- | --- | --- | --- |
| `id` | series Box | | The box to modify. |
| `right` | series int | | The new right coordinate (bar index or UNIX time). |
| `bottom` | series float | | The new bottom coordinate (price). |
---
### set_text {#set_text}
```navi
set_text(id: series Box, text: series String)
```
Sets the text size of the box.
**Parameters**
| Name | Type | Default | Description |
| --- | --- | --- | --- |
| `id` | series Box | | The box to modify. |
| `text` | series String | | The new text content. |
---
### set_text_color {#set_text_color}
```navi
set_text_color(id: series Box, text_color: series Color)
```
Sets the text color of the box.
**Parameters**
| Name | Type | Default | Description |
| --- | --- | --- | --- |
| `id` | series Box | | The box to modify. |
| `text_color` | series Color | | The new text color. |
---
### set_text_font_family {#set_text_font_family}
```navi
set_text_font_family(id: series Box, font_family: series String)
```
Sets the font family of the box text.
**Parameters**
| Name | Type | Default | Description |
| --- | --- | --- | --- |
| `id` | series Box | | The box to modify. |
| `font_family` | series String | | The font family: FontFamily.Default or FontFamily.Monospace. |
---
### set_text_formatting {#set_text_formatting}
```navi
set_text_formatting(id: series Box, text_formatting: const TextFormat)
```
Sets the text formatting of the box.
**Parameters**
| Name | Type | Default | Description |
| --- | --- | --- | --- |
| `id` | series Box | | The box to modify. |
| `text_formatting` | const TextFormat | | The text formatting options. |
---
### set_text_halign {#set_text_halign}
```navi
set_text_halign(id: series Box, text_halign: series TextHAlign)
```
Sets the horizontal alignment of the box text.
**Parameters**
| Name | Type | Default | Description |
| --- | --- | --- | --- |
| `id` | series Box | | The box to modify. |
| `text_halign` | series TextHAlign | | The horizontal text alignment: TextHAlign.Left, TextHAlign.Center, or TextHAlign.Right. |
---
### set_text_size {#set_text_size}
Sets the text size of the box.
**Parameters**
| Name | Type | Default | Description |
| --- | --- | --- | --- |
| `id` |
series Box | | The box to modify. |
| `text_size` |
series int | | The new text size in pixels. |
Sets the text size of the box.
**Parameters**
| Name | Type | Default | Description |
| --- | --- | --- | --- |
| `id` |
series Box | | The box to modify. |
| `text_size` |
series Size | | The new text size as a named constant (Size.Tiny, Size.Small, Size.Normal, Size.Large, Size.Huge). |
series Box | | The box to modify. |
| `text_valign` | series TextVAlign | | The vertical text alignment: TextVAlign.Top, TextHAlign.Center, or TextVAlign.Bottom. |
---
### set_text_wrap {#set_text_wrap}
```navi
set_text_wrap(id: series Box, text_wrap: series TextWrap)
```
Sets the text wrapping mode of the box.
**Parameters**
| Name | Type | Default | Description |
| --- | --- | --- | --- |
| `id` | series Box | | The box to modify. |
| `text_wrap` | series TextWrap | | The text wrapping mode: TextWrap.None or TextWrap.Auto. |
---
### set_top {#set_top}
```navi
set_top(id: series Box, top: series float)
```
Sets the top coordinate of the box.
**Parameters**
| Name | Type | Default | Description |
| --- | --- | --- | --- |
| `id` | series Box | | The box to modify. |
| `top` | series float | | The new top coordinate (price). |
---
### set_top_left_point {#set_top_left_point}
```navi
set_top_left_point(id: series Box, point: series chart.Point)
```
Sets the top-left corner of the box using a `chart.Point` object.
**Parameters**
| Name | Type | Default | Description |
| --- | --- | --- | --- |
| `id` | series Box | | The box to modify. |
| `point` | series chart.Point | | The `chart.Point` object specifying the new top-left corner. |
---
### set_xloc {#set_xloc}
```navi
set_xloc(id: series Box, left: series int, right: series int, xloc: series XLoc)
```
Sets the left and right borders of a box and updates its xloc property.
**Parameters**
| Name | Type | Default | Description |
| --- | --- | --- | --- |
| `id` | series Box | | The box to modify. |
| `left` | series int | | The new left coordinate (bar index or UNIX time). |
| `right` | series int | | The new right coordinate (bar index or UNIX time). |
| `xloc` | series XLoc | | The x-location type: XLoc.BarIndex or XLoc.BarTime. |
---
# BoxStyle
# BoxStyle
Box size assignment method for Renko / Kagi / Point & Figure.
**Kind:** enum
**Variants**
| Name | Description |
| --- | --- |
| `Atr` | Average True Range sizing (`param` is the ATR length). |
| `Traditional` | Fixed size (`param` is the box size). |
| `PercentageLtp` | Percentage of last trading price (`param` is the percent). |
---
# Color
# Color
A 32-bit RGBA color value.
## Static Methods
### from_gradient {#from_gradient}
```navi
from_gradient(
value: float,
bottom_value: float,
top_value: float,
bottom_color: Color,
top_color: Color
): Color
```
Creates a color that is a gradient between `bottom_color` and `top_color` based on the `value` between `bottom_value` and `top_value`.
**Parameters**
| Name | Type | Default | Description |
| --- | --- | --- | --- |
| `value` | float | | The value to use for interpolation (between bottom_value and top_value). |
| `bottom_value` | float | | The lower bound of the value range. |
| `top_value` | float | | The upper bound of the value range. |
| `bottom_color` | Color | | The color to use when value equals bottom_value. |
| `top_color` | Color | | The color to use when value equals top_value. |
**Returns:** Color
**See Also:** Color.new, Color.rgb, Color.mix
---
### mix {#mix}
```navi
mix(c1: Color, c2: Color, weight: float = 0.5): Color
```
Linearly blends two colors.
**Parameters**
| Name | Type | Default | Description |
| --- | --- | --- | --- |
| `c1` | Color | | The first color. |
| `c2` | Color | | The second color. |
| `weight` | float | `0.5` | Blend weight in [0.0, 1.0]. 0.0 = full `c1`, 1.0 = full `c2`. |
**Returns:** Color
**See Also:** Color.from_gradient
---
### new {#new}
```navi
new(color: Color, transp: float): Color
```
Creates a new color by changing the transparency of the given `color` to `transp` (0-100).
**Parameters**
| Name | Type | Default | Description |
| --- | --- | --- | --- |
| `color` | Color | | The color to modify. |
| `transp` | float | | The new transparency value (0-100). |
**Returns:** Color
**See Also:** Color.rgb, Color.from_gradient
---
### rgb {#rgb}
```navi
rgb(red: float, green: float, blue: float, transp: float = 0): Color
```
Creates a color from the specified red, green, blue components (0-255) and optional transparency (0-100).
**Parameters**
| Name | Type | Default | Description |
| --- | --- | --- | --- |
| `red` | float | | The red component value (0-255). |
| `green` | float | | The green component value (0-255). |
| `blue` | float | | The blue component value (0-255). |
| `transp` | float | `0` | The transparency value (0-100, default: 0.0). |
**Returns:** Color
**See Also:** Color.new, Color.from_gradient
## Static Properties
### AQUA {#AQUA}
**Type:** const Color
Color constant for `#00BCD4`.
---
### BLACK {#BLACK}
**Type:** const Color
Color constant for `#363A45`.
---
### BLUE {#BLUE}
**Type:** const Color
Color constant for `#2962FF`.
---
### BROWN {#BROWN}
**Type:** const Color
Color constant for `#795548`.
---
### CORAL {#CORAL}
**Type:** const Color
Color constant for `#FF7043`.
---
### CYAN {#CYAN}
**Type:** const Color
Color constant for `#00BFF3`.
---
### FUCHSIA {#FUCHSIA}
**Type:** const Color
Color constant for `#E040FB`.
---
### GOLD {#GOLD}
**Type:** const Color
Color constant for `#FFD700`.
---
### GRAY {#GRAY}
**Type:** const Color
Color constant for `#787B86`.
---
### GREEN {#GREEN}
**Type:** const Color
Color constant for `#4CAF50`.
---
### INDIGO {#INDIGO}
**Type:** const Color
Color constant for `#3F51B5`.
---
### LIME {#LIME}
**Type:** const Color
Color constant for `#00E676`.
---
### MAROON {#MAROON}
**Type:** const Color
Color constant for `#880E4F`.
---
### NAVY {#NAVY}
**Type:** const Color
Color constant for `#311B92`.
---
### OLIVE {#OLIVE}
**Type:** const Color
Color constant for `#808000`.
---
### ORANGE {#ORANGE}
**Type:** const Color
Color constant for `#FF9800`.
---
### PINK {#PINK}
**Type:** const Color
Color constant for `#E91E63`.
---
### PURPLE {#PURPLE}
**Type:** const Color
Color constant for `#9C27B0`.
---
### RED {#RED}
**Type:** const Color
Color constant for `#F23645`.
---
### SILVER {#SILVER}
**Type:** const Color
Color constant for `#B2B5BE`.
---
### TEAL {#TEAL}
**Type:** const Color
Color constant for `#089981`.
---
### VIOLET {#VIOLET}
**Type:** const Color
Color constant for `#7B1FA2`.
---
### WHITE {#WHITE}
**Type:** const Color
Color constant for `#FFFFFF`.
---
### YELLOW {#YELLOW}
**Type:** const Color
Color constant for `#FDD835`.
## Methods
### alpha {#alpha}
```navi
alpha(self: Color): float
```
Returns the transparency component of the given `color`.
**Parameters**
| Name | Type | Default | Description |
| --- | --- | --- | --- |
| `self` | Color | | |
**Returns:** float — A value in the range [0, 100] where 0 is fully opaque and 100 is fully transparent.
**See Also:** Color.red, Color.green, Color.blue
---
### blue {#blue}
```navi
blue(self: Color): float
```
Returns the blue component of the given `color`.
**Parameters**
| Name | Type | Default | Description |
| --- | --- | --- | --- |
| `self` | Color | | |
**Returns:** float — A value in the range [0, 255].
**See Also:** Color.red, Color.green, Color.alpha
---
### green {#green}
```navi
green(self: Color): float
```
Returns the green component of the given `color`.
**Parameters**
| Name | Type | Default | Description |
| --- | --- | --- | --- |
| `self` | Color | | |
**Returns:** float — A value in the range [0, 255].
**See Also:** Color.red, Color.blue, Color.alpha
---
### red {#red}
```navi
red(self: Color): float
```
Returns the red component of the given `color`.
**Parameters**
| Name | Type | Default | Description |
| --- | --- | --- | --- |
| `self` | Color | | |
**Returns:** float — A value in the range [0, 255].
**See Also:** Color.green, Color.blue, Color.alpha
---
# CommissionType
# CommissionType
Commission calculation mode for strategy.
**Kind:** enum
**Variants**
| Name | Description |
| --- | --- |
| `Percent` | Commission as a percentage of trade value. |
| `CashPerOrder` | Fixed cash amount per order. |
| `CashPerContract` | Fixed cash amount per contract. |
---
# Currency
# Currency
Currency code (ISO 4217).
**Kind:** enum
**Variants**
| Name | Description |
| --- | --- |
| `AED` | |
| `ARS` | |
| `AUD` | |
| `BDT` | |
| `BHD` | |
| `BRL` | |
| `BTC` | |
| `CAD` | |
| `CHF` | |
| `CLP` | |
| `CNY` | |
| `COP` | |
| `CZK` | |
| `DKK` | |
| `EGP` | |
| `ETH` | |
| `EUR` | |
| `GBP` | |
| `HKD` | |
| `HUF` | |
| `IDR` | |
| `ILS` | |
| `INR` | |
| `ISK` | |
| `JPY` | |
| `KES` | |
| `KRW` | |
| `KWD` | |
| `LKR` | |
| `MAD` | |
| `MXN` | |
| `MYR` | |
| `NGN` | |
| `NOK` | |
| `NONE` | |
| `NZD` | |
| `PEN` | |
| `PHP` | |
| `PKR` | |
| `PLN` | |
| `QAR` | |
| `RON` | |
| `RSD` | |
| `RUB` | |
| `SAR` | |
| `SEK` | |
| `SGD` | |
| `THB` | |
| `TND` | |
| `TRY` | |
| `TWD` | |
| `USD` | |
| `USDT` | |
| `VES` | |
| `VND` | |
| `ZAR` | |
---
# DayOfWeek
# DayOfWeek
Day of the week constant.
**Kind:** enum
**Variants**
| Name | Description |
| --- | --- |
| `Sunday` | Sunday (first day of the week). |
| `Monday` | Monday. |
| `Tuesday` | Tuesday. |
| `Wednesday` | Wednesday. |
| `Thursday` | Thursday. |
| `Friday` | Friday. |
| `Saturday` | Saturday. |
---
# DefaultQtyType
# DefaultQtyType
Default quantity mode for strategy.
**Kind:** enum
**Variants**
| Name | Description |
| --- | --- |
| `PercentOfEquity` | Quantity as a percentage of account equity. |
| `Fixed` | Fixed number of contracts or shares. |
| `Cash` | Quantity as a cash value. |
---
# Direction
# Direction
Direction for strategy orders.
**Kind:** enum
**Variants**
| Name | Description |
| --- | --- |
| `Long` | Open or add to a long position. |
| `Short` | Open or add to a short position. |
| `All` | Allow both long and short positions. |
---
# DividendsField
# DividendsField
Field selector for request.dividends.
**Kind:** enum
**Variants**
| Name | Description |
| --- | --- |
| `Gross` | Gross dividend (before withholding tax). |
| `Net` | Net dividend (after withholding tax). |
---
# EarningsField
# EarningsField
Field selector for request.earnings.
**Kind:** enum
**Variants**
| Name | Description |
| --- | --- |
| `Actual` | Actual reported earnings per share. |
| `Estimate` | Analyst consensus estimate before the report. |
| `Standardized` | Standardised (adjusted) earnings figure. |
---
# Extend
# Extend
Line extension direction.
**Kind:** enum
**Variants**
| Name | Description |
| --- | --- |
| `None` | No extension. |
| `Left` | Extend to the left. |
| `Right` | Extend to the right. |
| `Both` | Extend in both directions. |
---
# FontFamily
# FontFamily
Font family for text drawing.
**Kind:** enum
**Variants**
| Name | Description |
| --- | --- |
| `Default` | Default font. |
| `Monospace` | Monospace font. |
---
# Format
# Format
Number format for plots and labels.
**Kind:** enum
**Variants**
| Name | Description |
| --- | --- |
| `Inherit` | Inherit formatting from the parent series. |
| `Price` | Render as a price. |
| `Volume` | Render as a volume figure. |
| `Percent` | Render as a percentage. |
| `Mintick` | Round to the symbol's mintick and preserve trailing zeros. |
---
# HLine
# HLine
Handle for a horizontal line created by hline.
---
# HLineStyle
# HLineStyle
Style of a horizontal line drawing.
**Kind:** enum
**Variants**
| Name | Description |
| --- | --- |
| `Solid` | Solid horizontal line. |
| `Dashed` | Dashed horizontal line. |
| `Dotted` | Dotted horizontal line. |
---
# Label
# Label
Handle for a label drawing.
## Static Methods
### new {#new}
Creates a label object on the chart.
**Parameters**
| Name | Type | Default | Description |
| --- | --- | --- | --- |
| `point` |
series chart.Point | | The
chart.Point object specifying the position of the label. |
| `text` |
series String | `na` | The text to display on the label. |
| `xloc` |
series XLoc | `XLoc.BarIndex` | The x-location type: XLoc.BarIndex or XLoc.BarTime. |
| `yloc` |
series YLoc | `YLoc.Price` | The y-location type: YLoc.Price or YLoc.Price_range. |
| `color` |
series Color | `na` | The background color of the label. |
| `style` |
series LabelStyle | `LabelStyle.Down` | The style of the label. |
| `text_color` |
series Color | `na` | The color of the label text. |
| `size` |
series Size | `Size.Normal` | The size of the label as a named constant. |
| `text_align` |
series TextHAlign | `TextHAlign.Center` | The text alignment: TextHAlign.Center, TextHAlign.Left, or TextHAlign.Right. |
| `tooltip` |
series String | `na` | The tooltip text when hovering over the label. |
| `text_font_family` |
series FontFamily | `FontFamily.Default` | The font family for the label text. |
| `force_overlay` |
const bool | `false` | If true, the label is rendered on the top. |
| `text_formatting` |
const TextFormat | `TextFormat.NONE` | The text formatting options. |
**Returns:**
series Label
Creates a label object on the chart.
**Parameters**
| Name | Type | Default | Description |
| --- | --- | --- | --- |
| `point` |
series chart.Point | | The
chart.Point object specifying the position of the label. |
| `text` |
series String | `na` | The text to display on the label. |
| `xloc` |
series XLoc | `XLoc.BarIndex` | The x-location type: XLoc.BarIndex or XLoc.BarTime. |
| `yloc` |
series YLoc | `YLoc.Price` | The y-location type: YLoc.Price or YLoc.Price_range. |
| `color` |
series Color | `na` | The background color of the label. |
| `style` |
series LabelStyle | `LabelStyle.Down` | The style of the label. |
| `text_color` |
series Color | `na` | The color of the label text. |
| `size` |
series int | `0` | The size of the label as an integer value. |
| `text_align` |
series TextHAlign | `TextHAlign.Center` | The text alignment: TextHAlign.Center, TextHAlign.Left, or TextHAlign.Right. |
| `tooltip` |
series String | `na` | The tooltip text when hovering over the label. |
| `text_font_family` |
series FontFamily | `FontFamily.Default` | The font family for the label text. |
| `force_overlay` |
const bool | `false` | If true, the label is rendered on the top. |
| `text_formatting` |
const TextFormat | `TextFormat.NONE` | The text formatting options. |
**Returns:**
series Label
Creates a label object on the chart.
**Parameters**
| Name | Type | Default | Description |
| --- | --- | --- | --- |
| `x` |
series int | | The x-coordinate (bar index or UNIX time). |
| `y` |
series float | | The y-coordinate (price). |
| `text` |
series String | `na` | The text to display on the label. |
| `xloc` |
series XLoc | `XLoc.BarIndex` | The x-location type: XLoc.BarIndex or XLoc.BarTime. |
| `yloc` |
series YLoc | `YLoc.Price` | The y-location type: YLoc.Price or YLoc.Price_range. |
| `color` |
series Color | `na` | The background color of the label. |
| `style` |
series LabelStyle | `LabelStyle.Down` | The style of the label. |
| `text_color` |
series Color | `na` | The color of the label text. |
| `size` |
series Size | `Size.Normal` | The size of the label as a named constant. |
| `text_align` |
series TextHAlign | `TextHAlign.Center` | The text alignment: TextHAlign.Center, TextHAlign.Left, or TextHAlign.Right. |
| `tooltip` |
series String | `na` | The tooltip text when hovering over the label. |
| `text_font_family` |
series FontFamily | `FontFamily.Default` | The font family for the label text. |
| `force_overlay` |
const bool | `false` | If true, the label is rendered on the top. |
| `text_formatting` |
const TextFormat | `TextFormat.NONE` | The text formatting options. |
**Returns:**
series Label
Creates a label object on the chart.
**Parameters**
| Name | Type | Default | Description |
| --- | --- | --- | --- |
| `x` |
series int | | The x-coordinate (bar index or UNIX time). |
| `y` |
series float | | The y-coordinate (price). |
| `text` |
series String | `na` | The text to display on the label. |
| `xloc` |
series XLoc | `XLoc.BarIndex` | The x-location type: XLoc.BarIndex or XLoc.BarTime. |
| `yloc` |
series YLoc | `YLoc.Price` | The y-location type: YLoc.Price or YLoc.Price_range. |
| `color` |
series Color | `na` | The background color of the label. |
| `style` |
series LabelStyle | `LabelStyle.Down` | The style of the label. |
| `text_color` |
series Color | `na` | The color of the label text. |
| `size` |
series int | `0` | The size of the label as an integer value. |
| `text_align` |
series TextHAlign | `TextHAlign.Center` | The text alignment: TextHAlign.Center, TextHAlign.Left, or TextHAlign.Right. |
| `tooltip` |
series String | `na` | The tooltip text when hovering over the label. |
| `text_font_family` |
series FontFamily | `FontFamily.Default` | The font family for the label text. |
| `force_overlay` |
series bool | `false` | If true, the label is rendered on the top. |
| `text_formatting` |
const TextFormat | `TextFormat.NONE` | The text formatting options. |
**Returns:**
series Label
series Array<Label>
Returns an array filled with all the current labels drawn by the script.
## Methods
### copy {#copy}
```navi
copy(id: series Label): series Label
```
Creates a copy of the specified label and returns its id.
**Parameters**
| Name | Type | Default | Description |
| --- | --- | --- | --- |
| `id` | series Label | | The label to copy. |
**Returns:** series Label
---
### delete {#delete}
```navi
delete(id: series Label)
```
Deletes the specified label from the chart.
**Parameters**
| Name | Type | Default | Description |
| --- | --- | --- | --- |
| `id` | series Label | | The label to delete. |
---
### get_text {#get_text}
```navi
get_text(id: series Label): series String
```
Returns text of this label.
**Parameters**
| Name | Type | Default | Description |
| --- | --- | --- | --- |
| `id` | series Label | | The label to get the text from. |
**Returns:** series String
---
### get_x {#get_x}
```navi
get_x(id: series Label): series int
```
Returns UNIX time or bar index (depending on the last xloc value set) of this label's position.
**Parameters**
| Name | Type | Default | Description |
| --- | --- | --- | --- |
| `id` | series Label | | The label to get the x-coordinate from. |
**Returns:** series int
---
### get_y {#get_y}
```navi
get_y(id: series Label): series float
```
Returns price of this label's position.
**Parameters**
| Name | Type | Default | Description |
| --- | --- | --- | --- |
| `id` | series Label | | The label to get the y-coordinate from. |
**Returns:** series float
---
### set_color {#set_color}
```navi
set_color(id: series Label, color: series Color)
```
Sets color of this label.
**Parameters**
| Name | Type | Default | Description |
| --- | --- | --- | --- |
| `id` | series Label | | The label to modify. |
| `color` | series Color | | The new background color. |
---
### set_point {#set_point}
```navi
set_point(id: series Label, point: series chart.Point)
```
Sets the location of this label using a `chart.Point` object.
**Parameters**
| Name | Type | Default | Description |
| --- | --- | --- | --- |
| `id` | series Label | | The label to modify. |
| `point` | series chart.Point | | The `chart.Point` object specifying the new position. |
---
### set_size {#set_size}
Sets arrow and text size of this label.
**Parameters**
| Name | Type | Default | Description |
| --- | --- | --- | --- |
| `id` |
series Label | | The label to modify. |
| `size` |
series int | | The new size as an integer value. |
Sets arrow and text size of this label.
**Parameters**
| Name | Type | Default | Description |
| --- | --- | --- | --- |
| `id` |
series Label | | The label to modify. |
| `size` |
series Size | | The new size as a named constant (Size.Tiny, Size.Small, Size.Normal, Size.Large, Size.Huge). |
series Label | | The label to modify. |
| `style` | series LabelStyle | | The new label style constant. |
---
### set_text {#set_text}
```navi
set_text(id: series Label, text: series String)
```
Sets text of this label.
**Parameters**
| Name | Type | Default | Description |
| --- | --- | --- | --- |
| `id` | series Label | | The label to modify. |
| `text` | series String | | The new text to display. |
---
### set_text_align {#set_text_align}
```navi
set_text_align(id: series Label, text_align: series TextHAlign)
```
Sets text alignment of this label.
**Parameters**
| Name | Type | Default | Description |
| --- | --- | --- | --- |
| `id` | series Label | | The label to modify. |
| `text_align` | series TextHAlign | | The text alignment: TextHAlign.Center, TextHAlign.Left, or TextHAlign.Right. |
---
### set_text_color {#set_text_color}
```navi
set_text_color(id: series Label, text_color: series Color)
```
Sets text color of this label.
**Parameters**
| Name | Type | Default | Description |
| --- | --- | --- | --- |
| `id` | series Label | | The label to modify. |
| `text_color` | series Color | | The new text color. |
---
### set_text_font_family {#set_text_font_family}
```navi
set_text_font_family(id: series Label, text_font_family: series FontFamily)
```
Sets font family of this label.
**Parameters**
| Name | Type | Default | Description |
| --- | --- | --- | --- |
| `id` | series Label | | The label to modify. |
| `text_font_family` | series FontFamily | | The font family: FontFamily.Default or FontFamily.Monospace. |
---
### set_text_formatting {#set_text_formatting}
```navi
set_text_formatting(id: series Label, text_formatting: const TextFormat)
```
Sets text formatting of this label.
**Parameters**
| Name | Type | Default | Description |
| --- | --- | --- | --- |
| `id` | series Label | | The label to modify. |
| `text_formatting` | const TextFormat | | The text formatting options. |
---
### set_tooltip {#set_tooltip}
```navi
set_tooltip(id: series Label, tooltip: series String)
```
Sets tooltip text of this label.
**Parameters**
| Name | Type | Default | Description |
| --- | --- | --- | --- |
| `id` | series Label | | The label to modify. |
| `tooltip` | series String | | The new tooltip text. |
---
### set_x {#set_x}
```navi
set_x(id: series Label, x: series int)
```
Sets UNIX time or bar index (depending on the last xloc value set) of this label's position.
**Parameters**
| Name | Type | Default | Description |
| --- | --- | --- | --- |
| `id` | series Label | | The label to modify. |
| `x` | series int | | The new x-coordinate (bar index or UNIX time). |
---
### set_xloc {#set_xloc}
```navi
set_xloc(id: series Label, xloc: series XLoc)
```
Sets x location type of this label.
**Parameters**
| Name | Type | Default | Description |
| --- | --- | --- | --- |
| `id` | series Label | | The label to modify. |
| `xloc` | series XLoc | | The x-location type: XLoc.BarIndex or XLoc.BarTime. |
---
### set_xy {#set_xy}
```navi
set_xy(id: series Label, x: series int, y: series float)
```
Sets both x and y coordinates of this label's position.
**Parameters**
| Name | Type | Default | Description |
| --- | --- | --- | --- |
| `id` | series Label | | The label to modify. |
| `x` | series int | | The new x-coordinate (bar index or UNIX time). |
| `y` | series float | | The new y-coordinate (price). |
---
### set_y {#set_y}
```navi
set_y(id: series Label, y: series float)
```
Sets price of this label's position.
**Parameters**
| Name | Type | Default | Description |
| --- | --- | --- | --- |
| `id` | series Label | | The label to modify. |
| `y` | series float | | The new y-coordinate (price). |
---
### set_yloc {#set_yloc}
```navi
set_yloc(id: series Label, yloc: series YLoc)
```
Sets y location type of this label.
**Parameters**
| Name | Type | Default | Description |
| --- | --- | --- | --- |
| `id` | series Label | | The label to modify. |
| `yloc` | series YLoc | | The y-location type: YLoc.Price or YLoc.Price_range. |
---
# LabelStyle
# LabelStyle
Style of a label drawing.
**Kind:** enum
**Variants**
| Name | Description |
| --- | --- |
| `NoLabel` | No label shape. |
| `ArrowDown` | Label with downward-pointing arrow. |
| `ArrowUp` | Label with upward-pointing arrow. |
| `Circle` | Circular label. |
| `Cross` | Cross label. |
| `Diamond` | Diamond label. |
| `Flag` | Flag label. |
| `LabelCenter` | Centered label box. |
| `Down` | Label box pointing down. |
| `Left` | Label box pointing left. |
| `LowerLeft` | Label box pointing lower-left. |
| `LowerRight` | Label box pointing lower-right. |
| `Right` | Label box pointing right. |
| `Up` | Label box pointing up. |
| `UpperLeft` | Label box pointing upper-left. |
| `UpperRight` | Label box pointing upper-right. |
| `Square` | Square label. |
| `TextOutline` | Text outline label. |
| `TriangleDown` | Downward triangle label. |
| `TriangleUp` | Upward triangle label. |
| `XCross` | X-cross label. |
---
# Line
# Line
Handle for a line drawing.
## Static Methods
### new {#new}
Creates a line object on the chart.
**Parameters**
| Name | Type | Default | Description |
| --- | --- | --- | --- |
| `first_point` |
series chart.Point | | The
chart.Point object specifying the first point of the line. |
| `second_point` |
series chart.Point | | The
chart.Point object specifying the second point of the line. |
| `xloc` |
series XLoc | `XLoc.BarIndex` | The x-location type: XLoc.BarIndex or XLoc.BarTime. |
| `extend` |
series Extend | `Extend.None` | The extension mode: Extend.None, Extend.Left, Extend.Right, or Extend.Both. |
| `color` |
series Color | `na` | The color of the line. |
| `style` |
series LineStyle | `LineStyle.Solid` | The line style. |
| `width` |
series int | `1` | The line width in pixels. |
| `force_overlay` |
series bool | `false` | If true, the line is rendered on top. |
**Returns:**
series Line
Creates a line object on the chart.
**Parameters**
| Name | Type | Default | Description |
| --- | --- | --- | --- |
| `x1` |
series int | | The x-coordinate of the first point (bar index or UNIX time). |
| `y1` |
series float | | The y-coordinate of the first point (price). |
| `x2` |
series int | | The x-coordinate of the second point (bar index or UNIX time). |
| `y2` |
series float | | The y-coordinate of the second point (price). |
| `xloc` |
series XLoc | `XLoc.BarIndex` | The x-location type: XLoc.BarIndex or XLoc.BarTime. |
| `extend` |
series Extend | `Extend.None` | The extension mode: Extend.None, Extend.Left, Extend.Right, or Extend.Both. |
| `color` |
series Color | `na` | The color of the line. |
| `style` |
series LineStyle | `LineStyle.Solid` | The line style. |
| `width` |
series int | `1` | The line width in pixels. |
| `force_overlay` |
series bool | `false` | If true, the line is rendered on top. |
**Returns:**
series Line
series Array<Line>
Returns an array filled with all the current lines drawn by the script.
## Methods
### copy {#copy}
```navi
copy(id: series Line): series Line
```
Creates a copy of the specified line and returns its id.
**Parameters**
| Name | Type | Default | Description |
| --- | --- | --- | --- |
| `id` | series Line | | The line to copy. |
**Returns:** series Line
---
### delete {#delete}
```navi
delete(id: series Line)
```
Deletes the specified line from the chart.
**Parameters**
| Name | Type | Default | Description |
| --- | --- | --- | --- |
| `id` | series Line | | The line to delete. |
---
### get_price {#get_price}
```navi
get_price(id: series Line, x: series int): series float
```
Returns the price level of a line at a given bar index.
**Parameters**
| Name | Type | Default | Description |
| --- | --- | --- | --- |
| `id` | series Line | | The line to get the price from. |
| `x` | series int | | The bar index or UNIX time to get the price at. |
**Returns:** series float
---
### get_x1 {#get_x1}
```navi
get_x1(id: series Line): series int
```
Returns UNIX time or bar index (depending on the last xloc value set) of the first point of the line.
**Parameters**
| Name | Type | Default | Description |
| --- | --- | --- | --- |
| `id` | series Line | | The line to get the x1 coordinate from. |
**Returns:** series int
**See Also:** Line.get_x2, Line.get_y1
---
### get_x2 {#get_x2}
```navi
get_x2(id: series Line): series int
```
Returns UNIX time or bar index (depending on the last xloc value set) of the second point of the line.
**Parameters**
| Name | Type | Default | Description |
| --- | --- | --- | --- |
| `id` | series Line | | The line to get the x2 coordinate from. |
**Returns:** series int
**See Also:** Line.get_x1, Line.get_y2
---
### get_y1 {#get_y1}
```navi
get_y1(id: series Line): series float
```
Returns price of the first point of the line.
**Parameters**
| Name | Type | Default | Description |
| --- | --- | --- | --- |
| `id` | series Line | | The line to get the y1 coordinate from. |
**Returns:** series float
**See Also:** Line.get_y2, Line.get_x1
---
### get_y2 {#get_y2}
```navi
get_y2(id: series Line): series float
```
Returns price of the second point of the line.
**Parameters**
| Name | Type | Default | Description |
| --- | --- | --- | --- |
| `id` | series Line | | The line to get the y2 coordinate from. |
**Returns:** series float
**See Also:** Line.get_y1, Line.get_x2
---
### set_color {#set_color}
```navi
set_color(id: series Line, color: series Color)
```
Sets the line color.
**Parameters**
| Name | Type | Default | Description |
| --- | --- | --- | --- |
| `id` | series Line | | The line to modify. |
| `color` | series Color | | The new color of the line. |
---
### set_extend {#set_extend}
```navi
set_extend(id: series Line, extend: series Extend)
```
Sets extending type of this line object.
**Parameters**
| Name | Type | Default | Description |
| --- | --- | --- | --- |
| `id` | series Line | | The line to modify. |
| `extend` | series Extend | | The extension mode: Extend.None, Extend.Left, Extend.Right, or Extend.Both. |
---
### set_first_point {#set_first_point}
```navi
set_first_point(id: series Line, point: series chart.Point)
```
Sets the first point of this line object.
**Parameters**
| Name | Type | Default | Description |
| --- | --- | --- | --- |
| `id` | series Line | | The line to modify. |
| `point` | series chart.Point | | The chart.Point object specifying the new first point. |
---
### set_second_point {#set_second_point}
```navi
set_second_point(id: series Line, point: series chart.Point)
```
Sets the second point of this line object.
**Parameters**
| Name | Type | Default | Description |
| --- | --- | --- | --- |
| `id` | series Line | | The line to modify. |
| `point` | series chart.Point | | The chart.Point object specifying the new second point. |
---
### set_style {#set_style}
```navi
set_style(id: series Line, style: series LineStyle)
```
Sets the line style.
**Parameters**
| Name | Type | Default | Description |
| --- | --- | --- | --- |
| `id` | series Line | | The line to modify. |
| `style` | series LineStyle | | The new line style. |
---
### set_width {#set_width}
```navi
set_width(id: series Line, width: series int)
```
Sets the line width.
**Parameters**
| Name | Type | Default | Description |
| --- | --- | --- | --- |
| `id` | series Line | | The line to modify. |
| `width` | series int | | The new line width in pixels. |
---
### set_x1 {#set_x1}
```navi
set_x1(id: series Line, x: series int)
```
Sets bar index or bar time (depending on the xloc) of the first point.
**Parameters**
| Name | Type | Default | Description |
| --- | --- | --- | --- |
| `id` | series Line | | The line to modify. |
| `x` | series int | | The new x-coordinate for the first point. |
**See Also:** Line.set_x2, Line.set_xy1
---
### set_x2 {#set_x2}
```navi
set_x2(id: series Line, x: series int)
```
Sets bar index or bar time (depending on the xloc) of the second point.
**Parameters**
| Name | Type | Default | Description |
| --- | --- | --- | --- |
| `id` | series Line | | The line to modify. |
| `x` | series int | | The new x-coordinate for the second point. |
**See Also:** Line.set_x1, Line.set_xy2
---
### set_xloc {#set_xloc}
```navi
set_xloc(id: series Line, x1: series int, x2: series int, xloc: series XLoc)
```
Sets x-location and new bar index/time values.
**Parameters**
| Name | Type | Default | Description |
| --- | --- | --- | --- |
| `id` | series Line | | The line to modify. |
| `x1` | series int | | The new x-coordinate for the first point. |
| `x2` | series int | | The new x-coordinate for the second point. |
| `xloc` | series XLoc | | The x-location type: XLoc.BarIndex or XLoc.BarTime. |
---
### set_xy1 {#set_xy1}
```navi
set_xy1(id: series Line, x: series int, y: series float)
```
Sets bar index/time and price of the first point.
**Parameters**
| Name | Type | Default | Description |
| --- | --- | --- | --- |
| `id` | series Line | | The line to modify. |
| `x` | series int | | The new x-coordinate for the first point. |
| `y` | series float | | The new y-coordinate for the first point. |
**See Also:** Line.set_xy2, Line.set_x1, Line.set_y1
---
### set_xy2 {#set_xy2}
```navi
set_xy2(id: series Line, x: series int, y: series float)
```
Sets bar index/time and price of the second point.
**Parameters**
| Name | Type | Default | Description |
| --- | --- | --- | --- |
| `id` | series Line | | The line to modify. |
| `x` | series int | | The new x-coordinate for the second point. |
| `y` | series float | | The new y-coordinate for the second point. |
**See Also:** Line.set_xy1, Line.set_x2, Line.set_y2
---
### set_y1 {#set_y1}
```navi
set_y1(id: series Line, y: series float)
```
Sets price of the first point.
**Parameters**
| Name | Type | Default | Description |
| --- | --- | --- | --- |
| `id` | series Line | | The line to modify. |
| `y` | series float | | The new y-coordinate for the first point. |
**See Also:** Line.set_y2, Line.set_xy1
---
### set_y2 {#set_y2}
```navi
set_y2(id: series Line, y: series float)
```
Sets price of the second point.
**Parameters**
| Name | Type | Default | Description |
| --- | --- | --- | --- |
| `id` | series Line | | The line to modify. |
| `y` | series float | | The new y-coordinate for the second point. |
**See Also:** Line.set_y1, Line.set_xy2
---
# LineFill
# LineFill
Handle for a linefill between two lines.
## Static Methods
### new {#new}
```navi
new(
line1: series Line,
line2: series Line,
color: series Color
): series LineFill
```
Creates a new linefill object and displays it on the chart, filling the space between `line1` and `line2` with the color specified in `color`.
**Parameters**
| Name | Type | Default | Description |
| --- | --- | --- | --- |
| `line1` | series Line | | |
| `line2` | series Line | | |
| `color` | series Color | | |
**Returns:** series LineFill
## Static Properties
### all {#all}
**Type:** series Array<LineFill>
Returns an array filled with all the current linefills drawn by the script.
## Methods
### delete {#delete}
```navi
delete(id: series LineFill)
```
Deletes the specified linefill from the chart.
**Parameters**
| Name | Type | Default | Description |
| --- | --- | --- | --- |
| `id` | series LineFill | | |
---
### get_line1 {#get_line1}
```navi
get_line1(id: series LineFill): series Line
```
Returns the first line of the linefill.
**Parameters**
| Name | Type | Default | Description |
| --- | --- | --- | --- |
| `id` | series LineFill | | |
**Returns:** series Line
---
### get_line2 {#get_line2}
```navi
get_line2(id: series LineFill): series Line
```
Returns the second line of the linefill.
**Parameters**
| Name | Type | Default | Description |
| --- | --- | --- | --- |
| `id` | series LineFill | | |
**Returns:** series Line
---
### set_color {#set_color}
```navi
set_color(id: series LineFill, color: series Color)
```
Sets the color of the linefill.
**Parameters**
| Name | Type | Default | Description |
| --- | --- | --- | --- |
| `id` | series LineFill | | |
| `color` | series Color | | |
---
# LineStyle
# LineStyle
Style of a line drawing.
**Kind:** enum
**Variants**
| Name | Description |
| --- | --- |
| `Solid` | Solid line. |
| `Dashed` | Dashed line. |
| `Dotted` | Dotted line. |
| `ArrowLeft` | Solid line with left-facing arrow. |
| `ArrowRight` | Solid line with right-facing arrow. |
| `ArrowBoth` | Solid line with arrows on both ends. |
---
# Location
# Location
Vertical location for plot_shape and plot_char.
**Kind:** enum
**Variants**
| Name | Description |
| --- | --- |
| `AboveBar` | Above bar. |
| `BelowBar` | Below bar. |
| `Top` | Top of pane. |
| `Bottom` | Bottom of pane. |
| `Absolute` | Absolute price level. |
---
# Map
# Map<K, V>
A key-value store mapping keys of type `K` to values of type `V`.
Keys must be hashable: `int`, `float`, `bool`, `String`, `color`, or enum. Create with `Map.new()` or a map literal `{"key": value}`.
**Kind:** object
## Static Methods
### new {#new}
```navi
new(): const Map
```
Creates a new empty map of the specified key and value types.
**Returns:** const Map<K, V>
## Methods
### clear {#clear}
```navi
clear(id: Map)
```
Clears all entries from the given map.
**Parameters**
| Name | Type | Default | Description |
| --- | --- | --- | --- |
| `id` | Map<K, V> | | the map to clear. |
---
### contains {#contains}
```navi
contains(id: Map, key: K): bool
```
Checks if the specified key exists in the given map.
It returns `true` if the key is found, otherwise `false`.
**Parameters**
| Name | Type | Default | Description |
| --- | --- | --- | --- |
| `id` | Map<K, V> | | the map to search in. |
| `key` | K | | The key to check for existence. |
**Returns:** bool
---
### copy {#copy}
```navi
copy(id: Map): Map
```
Creates a copy of the given map and returns the new id.
**Parameters**
| Name | Type | Default | Description |
| --- | --- | --- | --- |
| `id` | Map<K, V> | | the map to copy. |
**Returns:** Map<K, V>
---
### get {#get}
```navi
get(id: Map, key: K): V
```
Retrieves the value associated with the specified key in the given id, or returns `na` if the key does not exist.
**Parameters**
| Name | Type | Default | Description |
| --- | --- | --- | --- |
| `id` | Map<K, V> | | the map to retrieve the value from. |
| `key` | K | | The key to look up in the map. |
**Returns:** V — The value associated with `key`, or `na` if the key does not exist.
---
### keys {#keys}
```navi
keys(id: Map): Array
```
Returns an array containing all the keys present in the given id.
**Parameters**
| Name | Type | Default | Description |
| --- | --- | --- | --- |
| `id` | Map<K, V> | | the map to get the keys from. |
**Returns:** Array<K>
---
### put {#put}
```navi
put(id: Map, key: K, value: V): V
```
Inserts or updates the value associated with the specified key in the given map.
It returns the previous value if the key existed, or `na` if it is a new entry.
**Parameters**
| Name | Type | Default | Description |
| --- | --- | --- | --- |
| `id` | Map<K, V> | | the map to insert or update a value in. |
| `key` | K | | The key to associate with the value. |
| `value` | V | | The value to insert or update. |
**Returns:** V — The previous value associated with `key`, or `na` if the key was not previously present.
---
### put_all {#put_all}
```navi
put_all(id: Map, id2: Map)
```
Copies all key-value pairs from the source map to the destination id.
Existing keys in the destination id will be updated with values from the source id.
**Parameters**
| Name | Type | Default | Description |
| --- | --- | --- | --- |
| `id` | Map<K, V> | | The destination id to copy values into. |
| `id2` | Map<K, V> | | The source id to copy values from. |
---
### remove {#remove}
```navi
remove(id: Map, key: K): V
```
Removes the entry associated with the specified key from the given map.
It returns the removed value if the key existed, or `na` if the key was not found.
**Parameters**
| Name | Type | Default | Description |
| --- | --- | --- | --- |
| `id` | Map<K, V> | | the map to remove a value from. |
| `key` | K | | The key of the entry to remove. |
**Returns:** V — The removed value, or `na` if the key was not found.
---
### size {#size}
```navi
size(id: Map): int
```
Returns the number of key-value pairs currently stored in the given map.
**Parameters**
| Name | Type | Default | Description |
| --- | --- | --- | --- |
| `id` | Map<K, V> | | the map to get the size of. |
**Returns:** int
---
### values {#values}
```navi
values(id: Map): Array
```
Returns an array containing all the values present in the given id.
**Parameters**
| Name | Type | Default | Description |
| --- | --- | --- | --- |
| `id` | Map<K, V> | | the map to get the values from. |
**Returns:** Array<V>
---
# Matrix
# Matrix<T>
A two-dimensional table of elements of type `T`, stored in row-major order.
Create with `Matrix.new()`. Access elements with `get` / `set`; iterate rows with `for row in mat`.
**Kind:** object
## Static Methods
### new {#new}
```navi
new(rows: int = 0, columns: int = 0, initial_value: T = na): const Matrix
```
Creates a new matrix with the specified number of rows and columns, initializing all elements to the given initial value.
**Parameters**
| Name | Type | Default | Description |
| --- | --- | --- | --- |
| `rows` | int | `0` | The number of rows in the matrix. |
| `columns` | int | `0` | The number of columns in the matrix. |
| `initial_value` | T | `na` | The initial value for all elements. |
**Returns:** const Matrix<T>
## Methods
### add_col {#add_col}
```navi
add_col(id: Matrix, column: int = na, values: Array = na)
```
Adds a new column to the specified matrix at the given column index, filling it with the provided values or `na` if no values are given.
**Parameters**
| Name | Type | Default | Description |
| --- | --- | --- | --- |
| `id` | Matrix<T> | | The matrix to which the column will be added. |
| `column` | int | `na` | The index at which the column will be inserted. When omitted, last column position. |
| `values` | Array<T> | `na` | An array of values to fill the column, or na to fill with na values. |
---
### add_row {#add_row}
```navi
add_row(id: Matrix, row: int = na, values: Array = na)
```
Adds a new row to the specified matrix at the given row index, filling it with the provided values or `na` if no values are given.
**Parameters**
| Name | Type | Default | Description |
| --- | --- | --- | --- |
| `id` | Matrix<T> | | The matrix to which the row will be added. |
| `row` | int | `na` | The index at which the row will be inserted. When omitted, last row position. |
| `values` | Array<T> | `na` | An array of values to fill the row, or na to fill with na values. |
---
### avg {#avg}
Calculates and returns the average of all elements in the specified matrix.
If the matrix is empty or contains no values, it returns `na`.
**Parameters**
| Name | Type | Default | Description |
| --- | --- | --- | --- |
| `id` |
Matrix<int> | | The integer matrix to calculate the average from. |
**Returns:**
float
Calculates and returns the average of all elements in the specified matrix.
**Parameters**
| Name | Type | Default | Description |
| --- | --- | --- | --- |
| `id` |
Matrix<float> | | The float matrix to calculate the average from. |
**Returns:**
float
Matrix<T> | | The matrix to retrieve the column from. |
| `column` | int | | The column index to retrieve. |
**Returns:** Array<T>
---
### columns {#columns}
```navi
columns(id: Matrix): int
```
Returns the number of columns in the specified matrix.
**Parameters**
| Name | Type | Default | Description |
| --- | --- | --- | --- |
| `id` | Matrix<T> | | The matrix to get the column count from. |
**Returns:** int
---
### concat {#concat}
```navi
concat(id1: Matrix, id2: Matrix): Matrix
```
Concatenates two matrices of the same type to the matrix and returns `id`.
**Parameters**
| Name | Type | Default | Description |
| --- | --- | --- | --- |
| `id1` | Matrix<T> | | The first matrix to concatenate. |
| `id2` | Matrix<T> | | The second matrix to concatenate. |
**Returns:** Matrix<T>
---
### copy {#copy}
```navi
copy(id: Matrix): Matrix
```
Creates a copy of the given matrix and returns the new matrix.
**Parameters**
| Name | Type | Default | Description |
| --- | --- | --- | --- |
| `id` | Matrix<T> | | The matrix to copy. |
**Returns:** Matrix<T>
---
### det {#det}
Calculates and returns the determinant of the specified square matrix.
**Parameters**
| Name | Type | Default | Description |
| --- | --- | --- | --- |
| `id` |
Matrix<int> | | The integer matrix to calculate the determinant from. |
**Returns:**
int
Calculates and returns the determinant of the specified square matrix.
**Parameters**
| Name | Type | Default | Description |
| --- | --- | --- | --- |
| `id` |
Matrix<float> | | The float matrix to calculate the determinant from. |
**Returns:**
float
Computes the element-wise difference between two matrices of the same dimensions and returns a new matrix containing the results.
**Parameters**
| Name | Type | Default | Description |
| --- | --- | --- | --- |
| `id1` |
Matrix<int> | | The first integer matrix. |
| `id2` |
Matrix<int> | | The second integer matrix. |
**Returns:**
Matrix<int>
Computes and returns the element-wise difference between two matrices of the same dimensions.
**Parameters**
| Name | Type | Default | Description |
| --- | --- | --- | --- |
| `id1` |
Matrix<float> | | The first float matrix. |
| `id2` |
Matrix<float> | | The second float matrix. |
**Returns:**
Matrix<float>
Computes and returns the element-wise difference between two matrices of the same dimensions.
**Parameters**
| Name | Type | Default | Description |
| --- | --- | --- | --- |
| `id1` |
Matrix<int> | | The first integer matrix. |
| `id2` |
Matrix<float> | | The second float matrix. |
**Returns:**
Matrix<float>
Computes and returns the element-wise difference between two matrices of the same dimensions.
**Parameters**
| Name | Type | Default | Description |
| --- | --- | --- | --- |
| `id1` |
Matrix<float> | | The first float matrix. |
| `id2` |
Matrix<int> | | The second integer matrix. |
**Returns:**
Matrix<float>
Calculates and returns the eigenvalues of the specified square matrix.
**Parameters**
| Name | Type | Default | Description |
| --- | --- | --- | --- |
| `id` |
Matrix<int> | | The integer square matrix to calculate eigenvalues from. |
**Returns:**
Matrix<float>
Returns the eigenvalues of the specified square matrix.
**Parameters**
| Name | Type | Default | Description |
| --- | --- | --- | --- |
| `id` |
Matrix<float> | | The float square matrix to calculate eigenvalues from. |
**Returns:**
Matrix<float>
Calculates and returns the eigenvectors of the specified square matrix.
**Parameters**
| Name | Type | Default | Description |
| --- | --- | --- | --- |
| `id` |
Matrix<int> | | The integer square matrix to calculate eigenvectors from. |
**Returns:**
Matrix<float>
Returns the eigenvectors of the specified square matrix.
**Parameters**
| Name | Type | Default | Description |
| --- | --- | --- | --- |
| `id` |
Matrix<float> | | The float square matrix to calculate eigenvectors from. |
**Returns:**
Matrix<float>
Matrix<T> | | The matrix to count the elements of. |
**Returns:** int
---
### fill {#fill}
```navi
fill(
id: Matrix,
value: T,
from_row: int = 0,
to_row: int = id.rows(),
from_column: int = 0,
to_column: int = id.columns()
)
```
Fills a specified submatrix of the given matrix with a specified value.
The submatrix is defined by the row and column ranges provided as parameters.
**Parameters**
| Name | Type | Default | Description |
| --- | --- | --- | --- |
| `id` | Matrix<T> | | The matrix to fill. |
| `value` | T | | The value to fill the submatrix with. |
| `from_row` | int | `0` | The starting row index. |
| `to_row` | int | `id.rows()` | The ending row index. When omitted, denotes matrix row count. |
| `from_column` | int | `0` | The starting column index. |
| `to_column` | int | `id.columns()` | The ending column index. When omitted, denotes matrix column count. |
---
### get {#get}
```navi
get(id: Matrix, row: int, column: int): T
```
Retrieves the value at the specified row and column indices from the given matrix.
**Parameters**
| Name | Type | Default | Description |
| --- | --- | --- | --- |
| `id` | Matrix<T> | | The matrix to retrieve the value from. |
| `row` | int | | The row index of the element. |
| `column` | int | | The column index of the element. |
**Returns:** T
---
### inv {#inv}
Computes and returns the inverse of the specified square matrix.
**Parameters**
| Name | Type | Default | Description |
| --- | --- | --- | --- |
| `id` |
Matrix<int> | | The integer square matrix to invert. |
**Returns:**
Matrix<float>
Computes the inverse of the specified square matrix.
**Parameters**
| Name | Type | Default | Description |
| --- | --- | --- | --- |
| `id` |
Matrix<float> | | The float square matrix to invert. |
**Returns:**
Matrix<float>
Checks if the given matrix is an antidiagonal matrix, returning `true` if it is and `false` otherwise.
**Parameters**
| Name | Type | Default | Description |
| --- | --- | --- | --- |
| `id` |
Matrix<int> | | The integer matrix to check. |
**Returns:**
bool
Checks if the given matrix is an antidiagonal matrix, returning `true` if it is and `false` otherwise.
**Parameters**
| Name | Type | Default | Description |
| --- | --- | --- | --- |
| `id` |
Matrix<float> | | The float matrix to check. |
**Returns:**
bool
Checks if the given matrix is an antisymmetric matrix, returning `true` if it is and `false` otherwise.
**Parameters**
| Name | Type | Default | Description |
| --- | --- | --- | --- |
| `id` |
Matrix<int> | | The integer matrix to check. |
**Returns:**
bool
Checks if the given matrix is an antisymmetric matrix, returning `true` if it is and `false` otherwise.
**Parameters**
| Name | Type | Default | Description |
| --- | --- | --- | --- |
| `id` |
Matrix<float> | | The float matrix to check. |
**Returns:**
bool
Checks if the given matrix is a binary matrix (containing only 0 and 1), returning `true` if it is and `false` otherwise.
**Parameters**
| Name | Type | Default | Description |
| --- | --- | --- | --- |
| `id` |
Matrix<int> | | The integer matrix to check. |
**Returns:**
bool
Checks if the given matrix is a binary matrix (containing only 0 and 1), returning `true` if it is and `false` otherwise.
**Parameters**
| Name | Type | Default | Description |
| --- | --- | --- | --- |
| `id` |
Matrix<float> | | The float matrix to check. |
**Returns:**
bool
Checks if the given matrix is a diagonal matrix, returning `true` if it is and `false` otherwise.
**Parameters**
| Name | Type | Default | Description |
| --- | --- | --- | --- |
| `id` |
Matrix<int> | | The integer matrix to check. |
**Returns:**
bool
Checks if the given matrix is a diagonal matrix, returning `true` if it is and `false` otherwise.
**Parameters**
| Name | Type | Default | Description |
| --- | --- | --- | --- |
| `id` |
Matrix<float> | | The float matrix to check. |
**Returns:**
bool
Checks if the given matrix is an identity matrix, returning `true` if it is and `false` otherwise.
**Parameters**
| Name | Type | Default | Description |
| --- | --- | --- | --- |
| `id` |
Matrix<int> | | The integer matrix to check. |
**Returns:**
bool
Checks if the given matrix is an identity matrix, returning `true` if it is and `false` otherwise.
**Parameters**
| Name | Type | Default | Description |
| --- | --- | --- | --- |
| `id` |
Matrix<float> | | The float matrix to check. |
**Returns:**
bool
Matrix<T> | | The matrix to check. |
**Returns:** bool
---
### is_stochastic {#is_stochastic}
Checks if the given matrix is a stochastic matrix, returning `true` if it is and `false` otherwise.
**Parameters**
| Name | Type | Default | Description |
| --- | --- | --- | --- |
| `id` |
Matrix<float> | | The float matrix to check. |
**Returns:**
bool
Checks if the given matrix is a stochastic matrix, returning `true` if it is and `false` otherwise.
**Parameters**
| Name | Type | Default | Description |
| --- | --- | --- | --- |
| `id` |
Matrix<int> | | The integer matrix to check. |
**Returns:**
bool
Checks if the given matrix is a symmetric matrix, returning `true` if it is and `false` otherwise.
**Parameters**
| Name | Type | Default | Description |
| --- | --- | --- | --- |
| `id` |
Matrix<int> | | The integer matrix to check. |
**Returns:**
bool
Checks if the given matrix is a symmetric matrix, returning `true` if it is and `false` otherwise.
**Parameters**
| Name | Type | Default | Description |
| --- | --- | --- | --- |
| `id` |
Matrix<float> | | The float matrix to check. |
**Returns:**
bool
Checks if the given matrix is a triangular matrix, returning `true` if it is and `false` otherwise.
**Parameters**
| Name | Type | Default | Description |
| --- | --- | --- | --- |
| `id` |
Matrix<int> | | The integer matrix to check. |
**Returns:**
bool
Checks if the given matrix is a triangular matrix, returning `true` if it is and `false` otherwise.
**Parameters**
| Name | Type | Default | Description |
| --- | --- | --- | --- |
| `id` |
Matrix<float> | | The float matrix to check. |
**Returns:**
bool
Checks if the given matrix is a zero matrix, returning `true` if it is and `false` otherwise.
**Parameters**
| Name | Type | Default | Description |
| --- | --- | --- | --- |
| `id` |
Matrix<int> | | The integer matrix to check. |
**Returns:**
bool
Checks if the given matrix is a zero matrix, returning `true` if it is and `false` otherwise.
**Parameters**
| Name | Type | Default | Description |
| --- | --- | --- | --- |
| `id` |
Matrix<float> | | The float matrix to check. |
**Returns:**
bool
Computes the Kronecker product of two matrices and returns the resulting matrix.
**Parameters**
| Name | Type | Default | Description |
| --- | --- | --- | --- |
| `id1` |
Matrix<int> | | The first integer matrix. |
| `id2` |
Matrix<int> | | The second integer matrix. |
**Returns:**
Matrix<int>
Computes the Kronecker product of two matrices and returns the resulting matrix.
**Parameters**
| Name | Type | Default | Description |
| --- | --- | --- | --- |
| `id1` |
Matrix<float> | | The first float matrix. |
| `id2` |
Matrix<float> | | The second float matrix. |
**Returns:**
Matrix<float>
Calculates and returns the maximum value among all elements in the specified matrix.
If the matrix is empty or contains no values, it returns `na`.
**Parameters**
| Name | Type | Default | Description |
| --- | --- | --- | --- |
| `id` |
Matrix<int> | | The integer matrix to find the maximum from. |
**Returns:**
int
Returns the maximum value among all elements.
**Parameters**
| Name | Type | Default | Description |
| --- | --- | --- | --- |
| `id` |
Matrix<float> | | The float matrix to find the maximum from. |
**Returns:**
float
Calculates and returns the median of all elements in the specified matrix.
If the matrix is empty or contains no values, it returns `na`.
**Parameters**
| Name | Type | Default | Description |
| --- | --- | --- | --- |
| `id` |
Matrix<int> | | The integer matrix to find the median from. |
**Returns:**
float
Calculates and returns the median of all elements in the specified matrix.
If the matrix is empty or contains no values, it returns `na`.
**Parameters**
| Name | Type | Default | Description |
| --- | --- | --- | --- |
| `id` |
Matrix<float> | | The float matrix to find the median from. |
**Returns:**
float
Calculates and returns the minimum value among all elements in the specified matrix.
If the matrix is empty or contains no values, it returns `na`.
**Parameters**
| Name | Type | Default | Description |
| --- | --- | --- | --- |
| `id` |
Matrix<int> | | The integer matrix to find the minimum from. |
**Returns:**
int
Returns the minimum value among all elements.
**Parameters**
| Name | Type | Default | Description |
| --- | --- | --- | --- |
| `id` |
Matrix<float> | | The float matrix to find the minimum from. |
**Returns:**
float
The function returns the mode of an matrix's elements.
If there are several values with the same frequency, it returns the smallest value.
**Parameters**
| Name | Type | Default | Description |
| --- | --- | --- | --- |
| `id` |
Matrix<int> | | The integer matrix to find the mode from. |
**Returns:**
int — The most frequently occurring value, or the smallest among tied values.
The function returns the mode of an matrix's elements.
If there are several values with the same frequency, it returns the smallest value.
**Parameters**
| Name | Type | Default | Description |
| --- | --- | --- | --- |
| `id` |
Matrix<float> | | The float matrix to find the mode from. |
**Returns:**
float — The most frequently occurring value, or the smallest among tied values.
Multiplies two matrices and returns the resulting matrix.
**Parameters**
| Name | Type | Default | Description |
| --- | --- | --- | --- |
| `id1` |
Matrix<int> | | The first integer matrix. |
| `id2` |
Matrix<int> | | The second integer matrix. |
**Returns:**
Matrix<int>
Matrix multiplication.
**Parameters**
| Name | Type | Default | Description |
| --- | --- | --- | --- |
| `id1` |
Matrix<float> | | The first float matrix. |
| `id2` |
Matrix<float> | | The second float matrix. |
**Returns:**
Matrix<float>
Matrix multiplication.
**Parameters**
| Name | Type | Default | Description |
| --- | --- | --- | --- |
| `id1` |
Matrix<int> | | The first integer matrix. |
| `id2` |
Matrix<float> | | The second float matrix. |
**Returns:**
Matrix<float>
Matrix multiplication.
**Parameters**
| Name | Type | Default | Description |
| --- | --- | --- | --- |
| `id1` |
Matrix<float> | | The first float matrix. |
| `id2` |
Matrix<int> | | The second integer matrix. |
**Returns:**
Matrix<float>
Computes and returns the Moore-Penrose pseudoinverse of the specified matrix.
**Parameters**
| Name | Type | Default | Description |
| --- | --- | --- | --- |
| `id` |
Matrix<int> | | The integer matrix to compute the pseudoinverse from. |
**Returns:**
Matrix<float>
Computes the Moore-Penrose pseudoinverse.
**Parameters**
| Name | Type | Default | Description |
| --- | --- | --- | --- |
| `id` |
Matrix<float> | | The float matrix to compute the pseudoinverse from. |
**Returns:**
Matrix<float>
Raises a square matrix to the specified non-negative integer power and returns the resulting matrix.
**Parameters**
| Name | Type | Default | Description |
| --- | --- | --- | --- |
| `id` |
Matrix<int> | | The integer square matrix to raise to a power. |
| `power` |
int | | The exponent (non-negative integer). |
**Returns:**
Matrix<int>
Raises a square matrix to the specified non-negative integer power and returns the resulting matrix.
**Parameters**
| Name | Type | Default | Description |
| --- | --- | --- | --- |
| `id` |
Matrix<float> | | The float square matrix to raise to a power. |
| `power` |
int | | The exponent (non-negative integer). |
**Returns:**
Matrix<float>
Calculates and returns the rank of the specified matrix.
**Parameters**
| Name | Type | Default | Description |
| --- | --- | --- | --- |
| `id` |
Matrix<int> | | The integer matrix to calculate the rank of. |
**Returns:**
int
Returns the rank of the matrix.
**Parameters**
| Name | Type | Default | Description |
| --- | --- | --- | --- |
| `id` |
Matrix<float> | | The float matrix to calculate the rank of. |
**Returns:**
int
Matrix<T> | | The matrix from which the column will be removed. |
| `column` | int | `na` | The index of the column to remove. When omitted, last column. |
**Returns:** Array<T> — An array containing the elements of the removed column.
---
### remove_row {#remove_row}
```navi
remove_row(id: Matrix, row: int = na): Array
```
Removes the specified row from the given matrix and returns the removed row as an array.
If no row index is provided, it removes the last row by default.
**Parameters**
| Name | Type | Default | Description |
| --- | --- | --- | --- |
| `id` | Matrix<T> | | The matrix from which the row will be removed. |
| `row` | int | `na` | The index of the row to remove. When omitted, last row. |
**Returns:** Array<T> — An array containing the elements of the removed row.
---
### reshape {#reshape}
```navi
reshape(id: Matrix, rows: int, columns: int)
```
Reshapes the given matrix to the specified number of rows and columns.
**Parameters**
| Name | Type | Default | Description |
| --- | --- | --- | --- |
| `id` | Matrix<T> | | The matrix to reshape. |
| `rows` | int | | The new number of rows. |
| `columns` | int | | The new number of columns. |
---
### reverse {#reverse}
```navi
reverse(id: Matrix)
```
Reverses the order of elements in the specified matrix in place.
**Parameters**
| Name | Type | Default | Description |
| --- | --- | --- | --- |
| `id` | Matrix<T> | | The matrix to reverse. |
---
### row {#row}
```navi
row(id: Matrix, row: int): Array
```
Retrieves all elements from the specified row of the matrix and returns them as an array.
**Parameters**
| Name | Type | Default | Description |
| --- | --- | --- | --- |
| `id` | Matrix<T> | | The matrix to retrieve the row from. |
| `row` | int | | The row index to retrieve. |
**Returns:** Array<T>
---
### rows {#rows}
```navi
rows(id: Matrix): int
```
Returns the number of rows in the specified matrix.
**Parameters**
| Name | Type | Default | Description |
| --- | --- | --- | --- |
| `id` | Matrix<T> | | The matrix to get the row count from. |
**Returns:** int
---
### set {#set}
```navi
set(id: Matrix, row: int, column: int, value: T)
```
Sets the value at the specified row and column indices in the given matrix to the provided value.
**Parameters**
| Name | Type | Default | Description |
| --- | --- | --- | --- |
| `id` | Matrix<T> | | The matrix to modify. |
| `row` | int | | The row index of the element. |
| `column` | int | | The column index of the element. |
| `value` | T | | The value to set at the specified position. |
---
### sort {#sort}
Sorts the elements of the given `matrix` in ascending or descending order.
**Parameters**
| Name | Type | Default | Description |
| --- | --- | --- | --- |
| `id` |
Matrix<int> | | The integer matrix to sort. |
| `order` |
any | `SortOrder.Ascending` | The sort order (ascending or descending). |
Sorts matrix elements.
**Parameters**
| Name | Type | Default | Description |
| --- | --- | --- | --- |
| `id` |
Matrix<float> | | The float matrix to sort. |
| `order` |
any | `SortOrder.Ascending` | The sort order (ascending or descending). |
Sorts matrix elements.
**Parameters**
| Name | Type | Default | Description |
| --- | --- | --- | --- |
| `id` |
Matrix<String> | | The String matrix to sort. |
| `order` |
any | `SortOrder.Ascending` | The sort order (ascending or descending). |
Matrix<T> | | The matrix to extract the submatrix from. |
| `from_row` | int | `0` | The starting row index. |
| `to_row` | int | `id.rows()` | The ending row index. When omitted, denotes matrix row count. |
| `from_column` | int | `0` | The starting column index. |
| `to_column` | int | `id.columns()` | The ending column index. When omitted, denotes matrix column count. |
**Returns:** Matrix<T>
---
### sum {#sum}
Computes the element-wise sum of two matrices of the same dimensions and returns a new matrix containing the results.
**Parameters**
| Name | Type | Default | Description |
| --- | --- | --- | --- |
| `id1` |
Matrix<int> | | The first integer matrix. |
| `id2` |
Matrix<int> | | The second integer matrix. |
**Returns:**
Matrix<int>
Computes the element-wise sum of two matrices of the same dimensions and returns a new matrix containing the results.
**Parameters**
| Name | Type | Default | Description |
| --- | --- | --- | --- |
| `id1` |
Matrix<float> | | The first float matrix. |
| `id2` |
Matrix<float> | | The second float matrix. |
**Returns:**
Matrix<float>
Computes the element-wise sum of two matrices of the same dimensions and returns a new matrix containing the results.
**Parameters**
| Name | Type | Default | Description |
| --- | --- | --- | --- |
| `id1` |
Matrix<int> | | The first integer matrix. |
| `id2` |
Matrix<float> | | The second float matrix. |
**Returns:**
Matrix<float>
Computes the element-wise sum of two matrices of the same dimensions and returns a new matrix containing the results.
**Parameters**
| Name | Type | Default | Description |
| --- | --- | --- | --- |
| `id1` |
Matrix<float> | | The first float matrix. |
| `id2` |
Matrix<int> | | The second integer matrix. |
**Returns:**
Matrix<float>
Matrix<T> | | The matrix containing the columns to swap. |
| `column1` | int | | The index of the first column. |
| `column2` | int | | The index of the second column. |
---
### swap_rows {#swap_rows}
```navi
swap_rows(id: Matrix, row1: int, row2: int)
```
Swaps two rows in the specified matrix.
**Parameters**
| Name | Type | Default | Description |
| --- | --- | --- | --- |
| `id` | Matrix<T> | | The matrix containing the rows to swap. |
| `row1` | int | | The index of the first row. |
| `row2` | int | | The index of the second row. |
---
### trace {#trace}
Calculates and returns the trace of the specified square matrix.
**Parameters**
| Name | Type | Default | Description |
| --- | --- | --- | --- |
| `id` |
Matrix<int> | | The integer square matrix to calculate the trace of. |
**Returns:**
int
Returns the trace of the square matrix.
**Parameters**
| Name | Type | Default | Description |
| --- | --- | --- | --- |
| `id` |
Matrix<float> | | The float square matrix to calculate the trace of. |
**Returns:**
float
Matrix<T> | | The matrix to transpose. |
**Returns:** Matrix<T>
---
# OcaType
# OcaType
OCA (One-Cancels-All) behavior for strategy orders.
**Kind:** enum
**Variants**
| Name | Description |
| --- | --- |
| `None` | No OCA group. |
| `Cancel` | Cancel sibling orders after one executes. |
| `Reduce` | Reduce sibling orders after one executes. |
---
# Plot
# Plot
Handle for a plot created by plot.
---
# PlotDisplay
# PlotDisplay
Bitflag type controlling where plots and visuals are shown.
## Static Properties
### ALL {#ALL}
**Type:** const PlotDisplay
`display` flag combination that enables every available output location.
---
### DATA_WINDOW {#DATA_WINDOW}
**Type:** const PlotDisplay
`display` flag that exposes values in the Data Window.
---
### NONE {#NONE}
**Type:** const PlotDisplay
`display` flag combination that hides the value or visual everywhere.
---
### PANE {#PANE}
**Type:** const PlotDisplay
`display` flag that draws output in a chart pane.
---
### PRICE_SCALE {#PRICE_SCALE}
**Type:** const PlotDisplay
`display` flag that shows a value on the price scale when chart settings allow it.
---
### SCREENER {#SCREENER}
**Type:** const PlotDisplay
`display` flag that makes a plot value available to Screener integrations.
---
### STATUS_LINE {#STATUS_LINE}
**Type:** const PlotDisplay
`display` flag that shows a value in the chart status line when enabled.
## Methods
### operator+ {#operator+}
```navi
operator+(a: PlotDisplay, b: PlotDisplay): PlotDisplay
```
Combines two display flags (bitwise OR).
**Parameters**
| Name | Type | Default | Description |
| --- | --- | --- | --- |
| `a` | PlotDisplay | | |
| `b` | PlotDisplay | | |
**Returns:** PlotDisplay
---
### operator- {#operator-}
```navi
operator-(a: PlotDisplay, b: PlotDisplay): PlotDisplay
```
Removes display flags from the first operand (bitwise difference).
**Parameters**
| Name | Type | Default | Description |
| --- | --- | --- | --- |
| `a` | PlotDisplay | | |
| `b` | PlotDisplay | | |
**Returns:** PlotDisplay
---
# PlotStyle
# PlotStyle
Style of a plot series.
**Kind:** enum
**Variants**
| Name | Description |
| --- | --- |
| `Line` | Line plot. |
| `LineBr` | Line plot that breaks on na. |
| `Area` | Area plot. |
| `AreaBr` | Area plot that breaks on na. |
| `Circles` | Circles plot. |
| `Columns` | Columns plot. |
| `Cross` | Cross plot. |
| `Histogram` | Histogram plot. |
| `Stepline` | Step line plot. |
| `SteplineDiamond` | Step line with diamond markers. |
| `SteplineBr` | Step line that breaks on na. |
---
# PnfSource
# PnfSource
Source used to calculate Point & Figure boxes.
**Kind:** enum
**Variants**
| Name | Description |
| --- | --- |
| `Hl` | Use high/low values. |
| `Close` | Use closing prices. |
---
# Polyline
# Polyline
Handle for a polyline drawing.
## Static Methods
### new {#new}
```navi
new(
points: series Array,
curved: series bool = false,
closed: series bool = false,
xloc: series XLoc = XLoc.BarIndex,
line_color: series Color = Color.BLUE,
fill_color: series Color = na,
line_style: series LineStyle = LineStyle.Solid,
line_width: series int = 1,
force_overlay: series bool = false
): series Polyline
```
Creates a new polyline instance and displays it on the chart, sequentially connecting all of the points in the points array with line segments.
The segments in the drawing can be straight or curved depending on the curved parameter.
**Parameters**
| Name | Type | Default | Description |
| --- | --- | --- | --- |
| `points` | series Array<chart.Point> | | An array of `chart.Point` values defining the vertices of the polyline in the order they will be connected. |
| `curved` | series bool | `false` | If `true`, the segments between consecutive points are drawn as smooth curves. If `false`, straight line segments are used. Optional. The default is `false`. |
| `closed` | series bool | `false` | If `true`, an additional segment is drawn from the last point back to the first, closing the shape. Optional. The default is `false`. |
| `xloc` | series XLoc | `XLoc.BarIndex` | Determines how the x-coordinate of each `chart.Point` is interpreted. Use `xloc.bar_index` to treat x as a bar index, or `xloc.bar_time` to treat x as a UNIX timestamp. Optional. The default is `xloc.bar_index`. |
| `line_color` | series Color | `Color.BLUE` | The color of the line segments. Optional. The default is `Color.BLUE`. |
| `fill_color` | series Color | `na` | The color used to fill the interior of the polyline when it is closed. `na` means no fill. Optional. The default is `na`. |
| `line_style` | series LineStyle | `LineStyle.Solid` | The style of the line. Possible values: `line.style_solid`, `line.style_dotted`, `line.style_dashed`, `line.style_arrow_left`, `line.style_arrow_right`, `line.style_arrow_both`. Optional. The default is `line.style_solid`. |
| `line_width` | series int | `1` | The width of the line in pixels. Optional. The default is `1`. |
| `force_overlay` | series bool | `false` | If `true`, the polyline is drawn on the main chart pane regardless of which pane the script occupies. If `false`, it follows the script's pane. Optional. The default is `false`. |
**Returns:** series Polyline
## Static Properties
### all {#all}
**Type:** series Array<Polyline>
Returns an array filled with all the current polylines drawn by the script.
## Methods
### delete {#delete}
```navi
delete(id: series Polyline)
```
Deletes the specified polyline from the chart.
**Parameters**
| Name | Type | Default | Description |
| --- | --- | --- | --- |
| `id` | series Polyline | | |
---
# Position
# Position
Table and label position on the chart pane.
**Kind:** enum
**Variants**
| Name | Description |
| --- | --- |
| `TopLeft` | Top-left corner. |
| `TopCenter` | Top-center. |
| `TopRight` | Top-right corner. |
| `MiddleLeft` | Middle-left. |
| `MiddleCenter` | Middle-center. |
| `MiddleRight` | Middle-right. |
| `BottomLeft` | Bottom-left corner. |
| `BottomCenter` | Bottom-center. |
| `BottomRight` | Bottom-right corner. |
---
# RenkoSource
# RenkoSource
Source used to calculate Renko bricks.
**Kind:** enum
**Variants**
| Name | Description |
| --- | --- |
| `Close` | Use closing prices only. |
| `Ohlc` | Use full OHLC values. |
---
# ScaleType
# ScaleType
Price scale attachment mode for indicator and strategy.
**Kind:** enum
**Variants**
| Name | Description |
| --- | --- |
| `None` | Do not attach to a price scale (use with `overlay = true`). |
| `Left` | Attach to the left price scale. |
| `Right` | Attach to the right price scale. |
---
# Session
# Session
Trading session type. Values are inclusive: a wider session also includes all narrower ones.
**Kind:** enum
**Variants**
| Name | Description |
| --- | --- |
| `Regular` | Regular trading hours only. |
| `Extended` | Regular hours plus pre-market and after-hours. |
| `Overnight` | Regular, extended, and overnight sessions (all). |
---
# SettlementAsClose
# SettlementAsClose
Whether a futures symbol's close is the settlement price on `1D`+.
**Kind:** enum
**Variants**
| Name | Description |
| --- | --- |
| `Inherit` | Use the chart symbol's default setting. |
| `On` | Use the settlement price as close. |
| `Off` | Use the actual closing price. |
---
# Shape
# Shape
Shape drawn by plot_shape.
**Kind:** enum
**Variants**
| Name | Description |
| --- | --- |
| `ArrowDown` | Downward arrow. |
| `ArrowUp` | Upward arrow. |
| `Circle` | Circle. |
| `Cross` | Cross. |
| `Diamond` | Diamond. |
| `Flag` | Flag. |
| `LabelDown` | Label pointing down. |
| `LabelUp` | Label pointing up. |
| `Square` | Square. |
| `TriangleDown` | Triangle pointing down. |
| `TriangleUp` | Triangle pointing up. |
| `XCross` | X-cross. |
---
# Size
# Size
Size constant for drawings and labels.
**Kind:** enum
**Variants**
| Name | Description |
| --- | --- |
| `Auto` | Automatically sized. |
| `Tiny` | Tiny size. |
| `Small` | Small size. |
| `Normal` | Normal size. |
| `Large` | Large size. |
| `Huge` | Huge size. |
---
# SortOrder
# SortOrder
Sort order for array and matrix operations.
**Kind:** enum
**Variants**
| Name | Description |
| --- | --- |
| `Ascending` | Sort from the smallest to the largest value. |
| `Descending` | Sort from the largest to the smallest value. |
---
# SplitsField
# SplitsField
Field selector for request.splits.
**Kind:** enum
**Variants**
| Name | Description |
| --- | --- |
| `Numerator` | Numerator of the split ratio (e.g. 4 in a 4-for-1 split). |
| `Denominator` | Denominator of the split ratio (e.g. 1 in a 4-for-1 split). |
---
# String
# String
An immutable sequence of Unicode characters.
## Static Methods
### format {#format}
```navi
format(template: String, values: any): String
```
Formats the String as a template, substituting indexed placeholders with the provided values.
**Placeholder syntax**: `{N}` or `{N, number}` or `{N, number, specifier}` where `N` is the zero-based index into `values`.
**Number specifiers** (used as `{N, number, specifier}`): - *(omitted)* — thousands separator, up to 3 decimal places - `integer` — round to integer, thousands separator - `currency` — prefix `$`, exactly 2 decimal places, thousands separator - `percent` — multiply by 100, append `%` - *pattern* — custom decimal-format pattern (see below)
**Custom number pattern characters**: - `#` — optional digit (trailing zeros omitted) - `0` — required digit (decimal part padded with `0`) - `,` — grouping separator; group size = number of digits after `,` in the integer part - `.` — decimal point - `%` — multiply value by 100 and append `%` - Any other character becomes a literal prefix or suffix - `'text'` — literal text (suppresses placeholder parsing inside quotes) - `''` — literal single-quote character
`na` values render as `"Na"`.
**Parameters**
| Name | Type | Default | Description |
| --- | --- | --- | --- |
| `template` | String | | The format template string containing `{N}` placeholders. |
| `values` | any | | Variable number of values to substitute into the template. |
**Returns:** String
---
### format_time {#format_time}
```navi
format_time(
time: int,
format: String,
timezone: String = symbol_info.timezone
): String
```
Formats a timestamp (in milliseconds since epoch) into a String using a pattern of format tokens and a timezone.
**Date tokens**: - `yyyy` — 4-digit year (e.g. `2024`) - `yy` — 2-digit year (e.g. `24`) - `MM` — month with leading zero (`01`–`12`) - `M` — month without leading zero (`1`–`12`) - `dd` — day of month with leading zero (`01`–`31`) - `d` — day of month without leading zero (`1`–`31`)
**Time tokens**: - `HH` — hour, 24-hour clock, with leading zero (`00`–`23`) - `H` — hour, 24-hour clock, without leading zero (`0`–`23`) - `hh` — hour, 12-hour clock, with leading zero (`01`–`12`) - `h` — hour, 12-hour clock, without leading zero (`1`–`12`) - `a` — AM/PM indicator - `mm` — minutes with leading zero (`00`–`59`) - `m` — minutes without leading zero (`0`–`59`) - `ss` — seconds with leading zero (`00`–`59`) - `s` — seconds without leading zero (`0`–`59`) - `S` — tenths of a second (1 digit) - `SS` — hundredths of a second (2 digits) - `SSS` — milliseconds (3 digits)
**Timezone token**: - `Z` — UTC offset in `±HHmm` form (e.g. `+0000`, `-0530`)
Any character that is not a format token is output as a literal (e.g. `-`, `:`, `.`, space). The characters `y`, `z` are reserved and must not be used alone (only `yy`/`yyyy` are valid; `z` is always an error).
**Parameters**
| Name | Type | Default | Description |
| --- | --- | --- | --- |
| `time` | int | | The timestamp in milliseconds since epoch to format. |
| `format` | String | | The format pattern string (see token table above). |
| `timezone` | String | `symbol_info.timezone` | The timezone for the output (e.g. `"UTC+8"`, `"UTC-5:30"`). Defaults to `symbol_info.timezone`. |
**Returns:** String
---
### from {#from}
Converts an integer to a String using a custom number pattern. The `format` string uses the same pattern syntax as the `{N, number, pattern}` specifier in
format:
- `#` — optional digit (trailing zeros omitted) - `0` — required digit (decimal part padded with `0`) - `,` — grouping separator; group size = digits after `,` in the integer part - `.` — decimal point - `%` — multiply value by 100 and append `%` - Any other character becomes a literal prefix or suffix - `'text'` — literal text - `''` — literal single-quote character
**Parameters**
| Name | Type | Default | Description |
| --- | --- | --- | --- |
| `value` |
int | | The integer value to convert. |
| `format` |
String | | The number pattern string controlling the output format. |
**Returns:**
String
Converts a float to a String using a custom number pattern. The `format` string uses the same pattern syntax as the `{N, number, pattern}` specifier in
format:
- `#` — optional digit (trailing zeros omitted) - `0` — required digit (decimal part padded with `0`) - `,` — grouping separator; group size = digits after `,` in the integer part - `.` — decimal point - `%` — multiply value by 100 and append `%` - Any other character becomes a literal prefix or suffix - `'text'` — literal text - `''` — literal single-quote character
**Parameters**
| Name | Type | Default | Description |
| --- | --- | --- | --- |
| `value` |
float | | The float value to convert. |
| `format` |
String | | The number pattern string controlling the output format. |
**Returns:**
String
Converts an integer to a String using a
Format constant. The `format` constant controls how the number is presented: -
Format.Inherit — inherits formatting from the enclosing series context -
Format.Price — formatted as a price (symbol-dependent precision) -
Format.Volume — formatted as a volume figure (compact notation for large numbers) -
Format.Percent — formatted as a percentage -
Format.Mintick — rounded to the symbol's mintick with trailing zeros preserved
**Parameters**
| Name | Type | Default | Description |
| --- | --- | --- | --- |
| `value` |
int | | The integer value to convert. |
| `format` |
Format | | The
Format constant controlling formatting. |
**Returns:**
String
Converts a float to a String using a
Format constant. The `format` constant controls how the number is presented: -
Format.Inherit — inherits formatting from the enclosing series context -
Format.Price — formatted as a price (symbol-dependent precision) -
Format.Volume — formatted as a volume figure (compact notation for large numbers) -
Format.Percent — formatted as a percentage -
Format.Mintick — rounded to the symbol's mintick with trailing zeros preserved
**Parameters**
| Name | Type | Default | Description |
| --- | --- | --- | --- |
| `value` |
float | | The float value to convert. |
| `format` |
Format | | The
Format constant controlling formatting. |
**Returns:**
String
Converts any value to its String representation.
**Parameters**
| Name | Type | Default | Description |
| --- | --- | --- | --- |
| `value` |
T | | The value to convert to String. |
**Returns:**
String
String | | |
| `str` | String | | The substring to search for. |
**Returns:** bool
---
### ends_with {#ends_with}
```navi
ends_with(self: String, str: String): bool
```
Checks if the String ends with the specified suffix.
**Parameters**
| Name | Type | Default | Description |
| --- | --- | --- | --- |
| `self` | String | | |
| `str` | String | | The suffix to search for. |
**Returns:** bool
**See Also:** String.starts_with
---
### index_of {#index_of}
```navi
index_of(self: String, str: String): int
```
Returns the zero-based index of the first occurrence of a substring, or `na` if not found.
**Parameters**
| Name | Type | Default | Description |
| --- | --- | --- | --- |
| `self` | String | | |
| `str` | String | | The substring to search for. |
**Returns:** int
---
### length {#length}
```navi
length(self: String): int
```
Returns the length of the String.
**Parameters**
| Name | Type | Default | Description |
| --- | --- | --- | --- |
| `self` | String | | |
**Returns:** int
---
### lower {#lower}
```navi
lower(self: String): String
```
Converts all characters in the String to lowercase.
**Parameters**
| Name | Type | Default | Description |
| --- | --- | --- | --- |
| `self` | String | | |
**Returns:** String
---
### match {#match}
```navi
match(self: String, regex: String): String
```
Returns the matched substring if the String matches a regex pattern, or an empty String otherwise.
**Parameters**
| Name | Type | Default | Description |
| --- | --- | --- | --- |
| `self` | String | | |
| `regex` | String | | The regular expression pattern to match. |
**Returns:** String
---
### pad_end {#pad_end}
```navi
pad_end(self: String, len: int, fill: String = " "): String
```
Right-pads the String with `fill` until it reaches at least `len` characters.
**Parameters**
| Name | Type | Default | Description |
| --- | --- | --- | --- |
| `self` | String | | |
| `len` | int | | The minimum target length in characters. |
| `fill` | String | `" "` | The padding String. Defaults to `" "`. |
**Returns:** String
**See Also:** String.pad_start
---
### pad_start {#pad_start}
```navi
pad_start(self: String, len: int, fill: String = " "): String
```
Left-pads the String with `fill` until it reaches at least `len` characters.
**Parameters**
| Name | Type | Default | Description |
| --- | --- | --- | --- |
| `self` | String | | |
| `len` | int | | The minimum target length in characters. |
| `fill` | String | `" "` | The padding String. Defaults to `" "`. |
**Returns:** String
**See Also:** String.pad_end
---
### repeat {#repeat}
```navi
repeat(self: String, repeat: int): String
```
Returns a new String consisting of the String repeated a specified number of times.
**Parameters**
| Name | Type | Default | Description |
| --- | --- | --- | --- |
| `self` | String | | |
| `repeat` | int | | The number of times to repeat the String. |
**Returns:** String
---
### replace {#replace}
```navi
replace(
self: String,
target: String,
replacement: String,
occurrence: int = 0
): String
```
Replaces the N-th occurrence of a target substring with a replacement.
**Parameters**
| Name | Type | Default | Description |
| --- | --- | --- | --- |
| `self` | String | | |
| `target` | String | | The substring to be replaced. |
| `replacement` | String | | The replacement substring. |
| `occurrence` | int | `0` | N-th occurrence to replace (0-indexed). Defaults to `0`. |
**Returns:** String
**See Also:** String.replace_all
---
### replace_all {#replace_all}
```navi
replace_all(self: String, target: String, replacement: String): String
```
Replaces all occurrences of a target substring with a replacement.
**Parameters**
| Name | Type | Default | Description |
| --- | --- | --- | --- |
| `self` | String | | |
| `target` | String | | The substring to be replaced. |
| `replacement` | String | | The replacement substring. |
**Returns:** String
**See Also:** String.replace
---
### split {#split}
```navi
split(self: String, separator: String): Array
```
Splits the String into an array of substrings based on a separator.
**Parameters**
| Name | Type | Default | Description |
| --- | --- | --- | --- |
| `self` | String | | |
| `separator` | String | | The separator String to split on. |
**Returns:** Array<String>
---
### starts_with {#starts_with}
```navi
starts_with(self: String, str: String): bool
```
Checks if the String starts with the specified prefix.
**Parameters**
| Name | Type | Default | Description |
| --- | --- | --- | --- |
| `self` | String | | |
| `str` | String | | The prefix to search for. |
**Returns:** bool
**See Also:** String.ends_with
---
### substring {#substring}
```navi
substring(self: String, begin_pos: int, end_pos: int): String
```
Returns a substring from `begin_pos` to `end_pos` (exclusive).
**Parameters**
| Name | Type | Default | Description |
| --- | --- | --- | --- |
| `self` | String | | |
| `begin_pos` | int | | The starting position (inclusive). |
| `end_pos` | int | | The ending position (exclusive). |
**Returns:** String
---
### to_number {#to_number}
```navi
to_number(self: String): float
```
Converts the String to a floating-point number.
**Parameters**
| Name | Type | Default | Description |
| --- | --- | --- | --- |
| `self` | String | | |
**Returns:** float — The parsed float value, or `na` if the String cannot be parsed.
---
### trim {#trim}
```navi
trim(self: String): String
```
Trims leading and trailing whitespace from the String.
**Parameters**
| Name | Type | Default | Description |
| --- | --- | --- | --- |
| `self` | String | | |
**Returns:** String
**See Also:** String.trim_start, String.trim_end
---
### trim_end {#trim_end}
```navi
trim_end(self: String): String
```
Trims trailing whitespace from the String.
**Parameters**
| Name | Type | Default | Description |
| --- | --- | --- | --- |
| `self` | String | | |
**Returns:** String
**See Also:** String.trim, String.trim_start
---
### trim_start {#trim_start}
```navi
trim_start(self: String): String
```
Trims leading whitespace from the String.
**Parameters**
| Name | Type | Default | Description |
| --- | --- | --- | --- |
| `self` | String | | |
**Returns:** String
**See Also:** String.trim, String.trim_end
---
### upper {#upper}
```navi
upper(self: String): String
```
Converts all characters in the String to uppercase.
**Parameters**
| Name | Type | Default | Description |
| --- | --- | --- | --- |
| `self` | String | | |
**Returns:** String
---
# Table
# Table
Handle for a table drawing.
## Static Methods
### new {#new}
```navi
new(
position: series Position,
columns: series int,
rows: series int,
bg_color: series Color = na,
frame_color: series Color = na,
frame_width: series int = 0,
border_color: series Color = na,
border_width: series int = 0,
force_overlay: series bool = false
): series Table
```
Creates a table object on the chart.
**Parameters**
| Name | Type | Default | Description |
| --- | --- | --- | --- |
| `position` | series Position | | The position of the table on the chart (e.g., position.top_left, position.top_center, etc.). |
| `columns` | series int | | The number of columns in the table. |
| `rows` | series int | | The number of rows in the table. |
| `bg_color` | series Color | `na` | The background color of the table. |
| `frame_color` | series Color | `na` | The frame border color of the table. |
| `frame_width` | series int | `0` | The frame border width in pixels. |
| `border_color` | series Color | `na` | The table border color. |
| `border_width` | series int | `0` | The table border width in pixels. |
| `force_overlay` | series bool | `false` | If true, the table is rendered on top. |
**Returns:** series Table
## Static Properties
### all {#all}
**Type:** series Array<Table>
Returns an array filled with all the current tables drawn by the script.
## Methods
### cell {#cell}
Sets the properties of a specific cell in a table.
**Parameters**
| Name | Type | Default | Description |
| --- | --- | --- | --- |
| `table_id` |
series Table | | The table object to modify. |
| `column` |
series int | | The column index of the cell (0-based). |
| `row` |
series int | | The row index of the cell (0-based). |
| `text` |
series String | `na` | The text content of the cell. |
| `width` |
series float | `0` | The width of the cell in pixels. |
| `height` |
series float | `0` | The height of the cell in pixels. |
| `text_color` |
series Color | `Color.BLACK` | The text color. |
| `text_halign` |
series TextHAlign | `TextHAlign.Center` | The horizontal text alignment. |
| `text_valign` |
series TextVAlign | `TextVAlign.Center` | The vertical text alignment. |
| `text_size` |
series int | `14` | The text size in pixels. |
| `bg_color` |
series Color | `na` | The background color of the cell. |
| `tooltip` |
series String | `na` | The tooltip text for the cell. |
| `text_font_family` |
series FontFamily | `FontFamily.Default` | The font family for the text. |
| `text_formatting` |
const TextFormat | `TextFormat.NONE` | The text formatting options. |
Sets the properties of a specific cell in a table.
Overload with text size as named constant.
**Parameters**
| Name | Type | Default | Description |
| --- | --- | --- | --- |
| `table_id` |
series Table | | The table object to modify. |
| `column` |
series int | | The column index of the cell (0-based). |
| `row` |
series int | | The row index of the cell (0-based). |
| `text` |
series String | `na` | The text content of the cell. |
| `width` |
series float | `0` | The width of the cell in pixels. |
| `height` |
series float | `0` | The height of the cell in pixels. |
| `text_color` |
series Color | `Color.BLACK` | The text color. |
| `text_halign` |
series TextHAlign | `TextHAlign.Center` | The horizontal text alignment. |
| `text_valign` |
series TextVAlign | `TextVAlign.Center` | The vertical text alignment. |
| `text_size` |
series Size | `Size.Auto` | The text size as a named constant. |
| `bg_color` |
series Color | `na` | The background color of the cell. |
| `tooltip` |
series String | `na` | The tooltip text for the cell. |
| `text_font_family` |
series FontFamily | `FontFamily.Default` | The font family for the text. |
| `text_formatting` |
const TextFormat | `TextFormat.NONE` | The text formatting options. |
series Table | | The table object to modify. |
| `column` | series int | | The column index of the cell (0-based). |
| `row` | series int | | The row index of the cell (0-based). |
| `bg_color` | series Color | | The new background color for the cell. |
---
### cell_set_height {#cell_set_height}
```navi
cell_set_height(
table_id: series Table,
column: series int,
row: series int,
height: series float
)
```
Sets the height of a specific cell in a table.
**Parameters**
| Name | Type | Default | Description |
| --- | --- | --- | --- |
| `table_id` | series Table | | The table object to modify. |
| `column` | series int | | The column index of the cell (0-based). |
| `row` | series int | | The row index of the cell (0-based). |
| `height` | series float | | The new height of the cell in pixels. |
---
### cell_set_text {#cell_set_text}
```navi
cell_set_text(
table_id: series Table,
column: series int,
row: series int,
text: series String
)
```
Sets the text of a specific cell in a table.
**Parameters**
| Name | Type | Default | Description |
| --- | --- | --- | --- |
| `table_id` | series Table | | The table object to modify. |
| `column` | series int | | The column index of the cell (0-based). |
| `row` | series int | | The row index of the cell (0-based). |
| `text` | series String | | The new text content for the cell. |
---
### cell_set_text_color {#cell_set_text_color}
```navi
cell_set_text_color(
table_id: series Table,
column: series int,
row: series int,
text_color: series Color
)
```
Sets the text color of a specific cell in a table.
**Parameters**
| Name | Type | Default | Description |
| --- | --- | --- | --- |
| `table_id` | series Table | | The table object to modify. |
| `column` | series int | | The column index of the cell (0-based). |
| `row` | series int | | The row index of the cell (0-based). |
| `text_color` | series Color | | The new text color for the cell. |
---
### cell_set_text_font_family {#cell_set_text_font_family}
```navi
cell_set_text_font_family(
table_id: series Table,
column: series int,
row: series int,
text_font_family: series String
)
```
Sets the font family of the text in a specific cell in a table.
**Parameters**
| Name | Type | Default | Description |
| --- | --- | --- | --- |
| `table_id` | series Table | | The table object to modify. |
| `column` | series int | | The column index of the cell (0-based). |
| `row` | series int | | The row index of the cell (0-based). |
| `text_font_family` | series String | | The font family: FontFamily.Default or font.family_monospace. |
---
### cell_set_text_formatting {#cell_set_text_formatting}
```navi
cell_set_text_formatting(
table_id: series Table,
column: series int,
row: series int,
text_formatting: const TextFormat
)
```
Sets the text formatting of the text in a specific cell in a table.
**Parameters**
| Name | Type | Default | Description |
| --- | --- | --- | --- |
| `table_id` | series Table | | The table object to modify. |
| `column` | series int | | The column index of the cell (0-based). |
| `row` | series int | | The row index of the cell (0-based). |
| `text_formatting` | const TextFormat | | The text formatting options. |
---
### cell_set_text_halign {#cell_set_text_halign}
```navi
cell_set_text_halign(
table_id: series Table,
column: series int,
row: series int,
text_halign: series String
)
```
Sets the horizontal alignment of the text in a specific cell in a table.
**Parameters**
| Name | Type | Default | Description |
| --- | --- | --- | --- |
| `table_id` | series Table | | The table object to modify. |
| `column` | series int | | The column index of the cell (0-based). |
| `row` | series int | | The row index of the cell (0-based). |
| `text_halign` | series String | | The horizontal text alignment: text.align_left, text.align_center, or text.align_right. |
---
### cell_set_text_size {#cell_set_text_size}
Sets the text size of a specific cell in a table.
**Parameters**
| Name | Type | Default | Description |
| --- | --- | --- | --- |
| `table_id` |
series Table | | The table object to modify. |
| `column` |
series int | | The column index of the cell (0-based). |
| `row` |
series int | | The row index of the cell (0-based). |
| `text_size` |
series int | | The new text size in pixels. |
Sets the text size of a specific cell in a table.
Overload with named size constant.
**Parameters**
| Name | Type | Default | Description |
| --- | --- | --- | --- |
| `table_id` |
series Table | | The table object to modify. |
| `column` |
series int | | The column index of the cell (0-based). |
| `row` |
series int | | The row index of the cell (0-based). |
| `text_size` |
series Size | | The new text size as a named constant (size.tiny, size.small, size.normal, size.large, size.huge). |
series Table | | The table object to modify. |
| `column` | series int | | The column index of the cell (0-based). |
| `row` | series int | | The row index of the cell (0-based). |
| `text_valign` | series String | | The vertical text alignment: text.align_top, text.align_center, or text.align_bottom. |
---
### cell_set_tooltip {#cell_set_tooltip}
```navi
cell_set_tooltip(
table_id: series Table,
column: series int,
row: series int,
tooltip: series String
)
```
Sets the tooltip of a specific cell in a table.
**Parameters**
| Name | Type | Default | Description |
| --- | --- | --- | --- |
| `table_id` | series Table | | The table object to modify. |
| `column` | series int | | The column index of the cell (0-based). |
| `row` | series int | | The row index of the cell (0-based). |
| `tooltip` | series String | | The new tooltip text for the cell. |
---
### cell_set_width {#cell_set_width}
```navi
cell_set_width(
table_id: series Table,
column: series int,
row: series int,
width: series float
)
```
Sets the width of a specific cell in a table.
**Parameters**
| Name | Type | Default | Description |
| --- | --- | --- | --- |
| `table_id` | series Table | | The table object to modify. |
| `column` | series int | | The column index of the cell (0-based). |
| `row` | series int | | The row index of the cell (0-based). |
| `width` | series float | | The new width of the cell in pixels. |
---
### clear {#clear}
```navi
clear(
table_id: series Table,
start_column: series int = 0,
start_row: series int = 0,
end_column: series int = na,
end_row: series int = na
)
```
Clears the contents of the specified range of cells in the table.
**Parameters**
| Name | Type | Default | Description |
| --- | --- | --- | --- |
| `table_id` | series Table | | The table to modify. |
| `start_column` | series int | `0` | The starting column index. |
| `start_row` | series int | `0` | The starting row index. |
| `end_column` | series int | `na` | The ending column index. When na, denotes last column. |
| `end_row` | series int | `na` | The ending row index. When na, denotes last row. |
---
### delete {#delete}
```navi
delete(table_id: series Table)
```
Deletes the table from the chart.
**Parameters**
| Name | Type | Default | Description |
| --- | --- | --- | --- |
| `table_id` | series Table | | The table to delete. |
---
### merge_cells {#merge_cells}
```navi
merge_cells(
table_id: series Table,
start_column: series int = 0,
start_row: series int = 0,
end_column: series int = na,
end_row: series int = na
)
```
Merges the specified range of cells in the table.
**Parameters**
| Name | Type | Default | Description |
| --- | --- | --- | --- |
| `table_id` | series Table | | The table to modify. |
| `start_column` | series int | `0` | The starting column index. |
| `start_row` | series int | `0` | The starting row index. |
| `end_column` | series int | `na` | The ending column index. When na, denotes last column. |
| `end_row` | series int | `na` | The ending row index. When na, denotes last row. |
---
### set_bg_color {#set_bg_color}
```navi
set_bg_color(table_id: series Table, bg_color: series Color)
```
Sets the background color of the table.
**Parameters**
| Name | Type | Default | Description |
| --- | --- | --- | --- |
| `table_id` | series Table | | The table object to modify. |
| `bg_color` | series Color | | The new background color of the table. |
---
### set_border_color {#set_border_color}
```navi
set_border_color(table_id: series Table, border_color: series Color)
```
Sets the border color of the table.
**Parameters**
| Name | Type | Default | Description |
| --- | --- | --- | --- |
| `table_id` | series Table | | The table object to modify. |
| `border_color` | series Color | | The new border color of the table. |
---
### set_border_width {#set_border_width}
```navi
set_border_width(table_id: series Table, border_width: series int)
```
Sets the border width of the table.
**Parameters**
| Name | Type | Default | Description |
| --- | --- | --- | --- |
| `table_id` | series Table | | The table object to modify. |
| `border_width` | series int | | The new border width in pixels. |
---
### set_frame_color {#set_frame_color}
```navi
set_frame_color(table_id: series Table, frame_color: series Color)
```
Sets the frame color of the table.
**Parameters**
| Name | Type | Default | Description |
| --- | --- | --- | --- |
| `table_id` | series Table | | The table object to modify. |
| `frame_color` | series Color | | The new frame border color of the table. |
---
### set_frame_width {#set_frame_width}
```navi
set_frame_width(table_id: series Table, frame_width: series int)
```
Sets the frame width of the table.
**Parameters**
| Name | Type | Default | Description |
| --- | --- | --- | --- |
| `table_id` | series Table | | The table object to modify. |
| `frame_width` | series int | | The new frame border width in pixels. |
---
### set_position {#set_position}
```navi
set_position(table_id: series Table, position: series Position)
```
Sets the position of the table.
**Parameters**
| Name | Type | Default | Description |
| --- | --- | --- | --- |
| `table_id` | series Table | | The table object to modify. |
| `position` | series Position | | The new position of the table on the chart. |
---
# TextFormat
# TextFormat
Text formatting flags (bold, italic). Values can be combined with `+`.
## Static Properties
### BOLD {#BOLD}
**Type:** const TextFormat
Text-format flag that renders supported text in bold.
---
### ITALIC {#ITALIC}
**Type:** const TextFormat
Text-format flag that renders supported text in italics.
---
### NONE {#NONE}
**Type:** const TextFormat
Text-format flag that applies no extra formatting.
## Methods
### operator+ {#operator+}
```navi
operator+(a: TextFormat, b: TextFormat): TextFormat
```
Combines two text-format flags (bitwise OR).
**Parameters**
| Name | Type | Default | Description |
| --- | --- | --- | --- |
| `a` | TextFormat | | |
| `b` | TextFormat | | |
**Returns:** TextFormat
---
### operator- {#operator-}
```navi
operator-(a: TextFormat, b: TextFormat): TextFormat
```
Removes text-format flags from the first operand (bitwise difference).
**Parameters**
| Name | Type | Default | Description |
| --- | --- | --- | --- |
| `a` | TextFormat | | |
| `b` | TextFormat | | |
**Returns:** TextFormat
---
# TextHAlign
# TextHAlign
Horizontal text alignment.
**Kind:** enum
**Variants**
| Name | Description |
| --- | --- |
| `Left` | Left-aligned. |
| `Center` | Center-aligned. |
| `Right` | Right-aligned. |
---
# TextVAlign
# TextVAlign
Vertical text alignment.
**Kind:** enum
**Variants**
| Name | Description |
| --- | --- |
| `Top` | Top-aligned. |
| `Center` | Center-aligned. |
| `Bottom` | Bottom-aligned. |
---
# TextWrap
# TextWrap
Text wrapping mode.
**Kind:** enum
**Variants**
| Name | Description |
| --- | --- |
| `Auto` | Automatic wrapping. |
| `None` | No wrapping. |
---
# XLoc
# XLoc
X-axis coordinate mode for drawings.
**Kind:** enum
**Variants**
| Name | Description |
| --- | --- |
| `BarIndex` | X-coordinate is a bar index. |
| `BarTime` | X-coordinate is a UNIX timestamp in milliseconds. |
---
# YLoc
# YLoc
Y-axis coordinate mode for labels.
**Kind:** enum
**Variants**
| Name | Description |
| --- | --- |
| `Price` | Y-coordinate is a price value. |
| `AboveBar` | Above the bar. |
| `BelowBar` | Below the bar. |
---
# prelude
# prelude
::: tip
The prelude is loaded automatically into every script. Its types and functions are referenced directly by name — do **not** use a namespace prefix (e.g. write `close`, not `prelude.close`).
:::
## Types
| Name | Description |
| --- | --- |
| [`Adjustment`](/api/stdlib/prelude/Adjustment) | Price adjustment type for requested data. |
| [`AlertFreq`](/api/stdlib/prelude/AlertFreq) | Alert frequency constant for alert. |
| [`Array`](/api/stdlib/prelude/Array) | An ordered, indexable collection of elements of type `T`. |
| [`BackAdjustment`](/api/stdlib/prelude/BackAdjustment) | Back-adjustment for continuous futures contracts. |
| [`BarmergeGaps`](/api/stdlib/prelude/BarmergeGaps) | Gap mode for `request.*()` functions. |
| [`BarmergeLookahead`](/api/stdlib/prelude/BarmergeLookahead) | Lookahead mode for `request.*()` functions. |
| [`Box`](/api/stdlib/prelude/Box) | Handle for a box drawing. |
| [`BoxStyle`](/api/stdlib/prelude/BoxStyle) | Box size assignment method for Renko / Kagi / Point & Figure. |
| [`Color`](/api/stdlib/prelude/Color) | A 32-bit RGBA color value. |
| [`CommissionType`](/api/stdlib/prelude/CommissionType) | Commission calculation mode for strategy. |
| [`Currency`](/api/stdlib/prelude/Currency) | Currency code (ISO 4217). |
| [`DayOfWeek`](/api/stdlib/prelude/DayOfWeek) | Day of the week constant. |
| [`DefaultQtyType`](/api/stdlib/prelude/DefaultQtyType) | Default quantity mode for strategy. |
| [`Direction`](/api/stdlib/prelude/Direction) | Direction for strategy orders. |
| [`DividendsField`](/api/stdlib/prelude/DividendsField) | Field selector for request.dividends. |
| [`EarningsField`](/api/stdlib/prelude/EarningsField) | Field selector for request.earnings. |
| [`Extend`](/api/stdlib/prelude/Extend) | Line extension direction. |
| [`FontFamily`](/api/stdlib/prelude/FontFamily) | Font family for text drawing. |
| [`Format`](/api/stdlib/prelude/Format) | Number format for plots and labels. |
| [`HLine`](/api/stdlib/prelude/HLine) | Handle for a horizontal line created by hline. |
| [`HLineStyle`](/api/stdlib/prelude/HLineStyle) | Style of a horizontal line drawing. |
| [`Label`](/api/stdlib/prelude/Label) | Handle for a label drawing. |
| [`LabelStyle`](/api/stdlib/prelude/LabelStyle) | Style of a label drawing. |
| [`Line`](/api/stdlib/prelude/Line) | Handle for a line drawing. |
| [`LineFill`](/api/stdlib/prelude/LineFill) | Handle for a linefill between two lines. |
| [`LineStyle`](/api/stdlib/prelude/LineStyle) | Style of a line drawing. |
| [`Location`](/api/stdlib/prelude/Location) | Vertical location for plot_shape and plot_char. |
| [`Map`](/api/stdlib/prelude/Map) | A key-value store mapping keys of type `K` to values of type `V`. |
| [`Matrix`](/api/stdlib/prelude/Matrix) | A two-dimensional table of elements of type `T`, stored in row-major order. |
| [`OcaType`](/api/stdlib/prelude/OcaType) | OCA (One-Cancels-All) behavior for strategy orders. |
| [`Plot`](/api/stdlib/prelude/Plot) | Handle for a plot created by plot. |
| [`PlotDisplay`](/api/stdlib/prelude/PlotDisplay) | Bitflag type controlling where plots and visuals are shown. |
| [`PlotStyle`](/api/stdlib/prelude/PlotStyle) | Style of a plot series. |
| [`PnfSource`](/api/stdlib/prelude/PnfSource) | Source used to calculate Point & Figure boxes. |
| [`Polyline`](/api/stdlib/prelude/Polyline) | Handle for a polyline drawing. |
| [`Position`](/api/stdlib/prelude/Position) | Table and label position on the chart pane. |
| [`RenkoSource`](/api/stdlib/prelude/RenkoSource) | Source used to calculate Renko bricks. |
| [`ScaleType`](/api/stdlib/prelude/ScaleType) | Price scale attachment mode for indicator and strategy. |
| [`Session`](/api/stdlib/prelude/Session) | Trading session type. |
| [`SettlementAsClose`](/api/stdlib/prelude/SettlementAsClose) | Whether a futures symbol's close is the settlement price on `1D`+. |
| [`Shape`](/api/stdlib/prelude/Shape) | Shape drawn by plot_shape. |
| [`Size`](/api/stdlib/prelude/Size) | Size constant for drawings and labels. |
| [`SortOrder`](/api/stdlib/prelude/SortOrder) | Sort order for array and matrix operations. |
| [`SplitsField`](/api/stdlib/prelude/SplitsField) | Field selector for request.splits. |
| [`String`](/api/stdlib/prelude/String) | An immutable sequence of Unicode characters. |
| [`Table`](/api/stdlib/prelude/Table) | Handle for a table drawing. |
| [`TextFormat`](/api/stdlib/prelude/TextFormat) | Text formatting flags (bold, italic). |
| [`TextHAlign`](/api/stdlib/prelude/TextHAlign) | Horizontal text alignment. |
| [`TextVAlign`](/api/stdlib/prelude/TextVAlign) | Vertical text alignment. |
| [`TextWrap`](/api/stdlib/prelude/TextWrap) | Text wrapping mode. |
| [`XLoc`](/api/stdlib/prelude/XLoc) | X-axis coordinate mode for drawings. |
| [`YLoc`](/api/stdlib/prelude/YLoc) | Y-axis coordinate mode for labels. |
## Properties
### ask {#ask}
**Type:** series float
Best ask price of the current bar.
The ask price is the lowest price at which a seller is willing to sell. Only available on `1T` (tick) timeframes; returns `na` on all other timeframes.
---
### bar_index {#bar_index}
**Type:** series int
Index of the current bar.
Numbering is zero-based, so the first (oldest) bar on the chart has index 0. The value increases by 1 for each subsequent bar. Use `bar_index[1]` to reference the previous bar's index.
---
### bid {#bid}
**Type:** series float
Best bid price of the current bar.
The bid price is the highest price a buyer is willing to pay. Only available on `1T` (tick) timeframes; returns `na` on all other timeframes.
---
### close {#close}
**Type:** series float
Closing price of the current bar.
On historical bars, this is the last traded price when the bar closed. On real-time bars, this is the current last traded price and will change until the bar closes.
---
### day_of_month {#prop-day_of_month}
**Type:** int
Returns the day of month (1-31) of the current bar's opening time in the symbol's timezone.
---
### day_of_week {#prop-day_of_week}
**Type:** DayOfWeek
Returns the day of week of the current bar's opening time.
---
### high {#high}
**Type:** series float
Highest price reached during the current bar.
On historical bars, this is the maximum traded price. On real-time bars, this value can increase as new highs are made.
---
### hl2 {#hl2}
**Type:** series float
The midpoint of high and low prices: `(high + low) / 2`.
Also known as the median price. Useful as a simple estimate of the bar's central price.
---
### hlc3 {#hlc3}
**Type:** series float
The typical price: `(high + low + close) / 3`.
A common price proxy that weights the close equally with the high-low range. Often used in volume weighted calculations.
---
### hlcc4 {#hlcc4}
**Type:** series float
Weighted close price: `(high + low + close + close) / 4`.
Places extra weight on the closing price, giving it 50% of the total weight.
---
### hour {#prop-hour}
**Type:** int
Returns the hour (0-23) of the current bar's opening time in the symbol's timezone.
---
### last_bar_index {#last_bar_index}
**Type:** series int
Index of the last (newest) bar on the chart.
Combined with `bar_index`, this can be used to determine the distance from the current bar to the chart's end, e.g., `last_bar_index - bar_index` gives bars remaining.
---
### last_bar_time {#last_bar_time}
**Type:** series int
Timestamp of the last bar on the chart, in UNIX format (milliseconds since 1970-01-01 00:00:00 UTC).
Useful for determining the chart's time range or for time-based calculations relative to the chart end.
---
### low {#low}
**Type:** series float
Lowest price reached during the current bar.
On historical bars, this is the minimum traded price. On real-time bars, this value can decrease as new lows are made.
---
### minute {#prop-minute}
**Type:** int
Returns the minute (0-59) of the current bar's opening time in the symbol's timezone.
---
### month {#prop-month}
**Type:** int
Returns the month (1-12) of the current bar's opening time in the symbol's timezone.
---
### ohlc4 {#ohlc4}
**Type:** series float
Average price: `(open + high + low + close) / 4`.
The arithmetic mean of all four OHLC prices, representing the bar's overall price activity.
---
### open {#open}
**Type:** series float
Opening price of the current bar.
This is the first traded price when the bar opened. On real-time bars, this value is fixed once the bar opens.
---
### second {#prop-second}
**Type:** int
Returns the second (0-59) of the current bar's opening time in the symbol's timezone.
---
### time {#prop-time}
**Type:** series int
UNIX timestamp for the bar's left edge.
The value is expressed in milliseconds from the Unix epoch and does not drift while the current realtime bar is still forming.
---
### time_close {#prop-time_close}
**Type:** series int
UNIX timestamp for the bar's right edge.
On time-based charts this is the scheduled close of the active bar.
---
### time_now {#time_now}
**Type:** series int
Current real-world time in UNIX format (milliseconds since 1970-01-01 00:00:00 UTC).
Unlike `time`, which returns the bar's time, `timenow` returns the actual current time and updates continuously on real-time bars.
---
### time_tradingday {#time_tradingday}
**Type:** series int
Returns a UTC-midnight marker for the exchange session the current bar belongs to.
The result stays identical for all bars that share the same trading session, which is handy when sessions bleed across calendar boundaries.
---
### volume {#volume}
**Type:** series float
Trading volume of the current bar.
Represents the total number of shares or contracts traded. May be `na` if volume data is unavailable for the symbol.
---
### week_of_year {#prop-week_of_year}
**Type:** int
Returns the week of year (1-53) of the current bar's opening time in the symbol's timezone.
---
### year {#prop-year}
**Type:** int
Returns the year of the current bar's opening time in the symbol's timezone.
## Functions
### alert {#alert}
```navi
alert(message: series String, freq: input AlertFreq = AlertFreq.OncePerBar)
```
Creates an alert with the given message and frequency.
**Parameters**
| Name | Type | Default | Description |
| --- | --- | --- | --- |
| `message` | series String | | |
| `freq` | input AlertFreq | `AlertFreq.OncePerBar` | |
---
### alert_condition {#alert_condition}
```navi
alert_condition(
condition: series bool,
title: const String,
message: const String
)
```
Creates an alert condition that can be used to trigger alerts based on a boolean condition.
**Parameters**
| Name | Type | Default | Description |
| --- | --- | --- | --- |
| `condition` | series bool | | |
| `title` | const String | | |
| `message` | const String | | |
---
### bar_color {#bar_color}
```navi
bar_color(
color: series Color,
offset: simple int = 0,
editable: input bool = true,
show_last: input int = na,
title: const String = na,
display: input PlotDisplay
)
```
Sets the color of price bars on the chart.
Each bar can have its own color, allowing for dynamic coloring based on indicator conditions.
**Parameters**
| Name | Type | Default | Description |
| --- | --- | --- | --- |
| `color` | series Color | | The color to apply to the bar. Use `na` to keep the default color. |
| `offset` | simple int | `0` | Shifts the coloring left (negative) or right (positive) by the specified number of bars. |
| `editable` | input bool | `true` | If true, the setting can be edited in the style dialog. |
| `show_last` | input int | `na` | If set, only colors the last N bars. |
| `title` | const String | `na` | Title shown in the style dialog. |
| `display` | input PlotDisplay | | Controls where the coloring is visible. |
**See Also:** bg_color
---
### bg_color {#bg_color}
```navi
bg_color(
color: series Color,
offset: simple int = 0,
editable: input bool = true,
show_last: input int = na,
title: const String = na,
display: input PlotDisplay = PlotDisplay.ALL,
force_overlay: const bool = na
)
```
Fills the background of chart bars with a specified color.
Useful for highlighting specific conditions or time periods on the chart.
**Parameters**
| Name | Type | Default | Description |
| --- | --- | --- | --- |
| `color` | series Color | | The background color. Use `na` for transparent. |
| `offset` | simple int | `0` | Shifts the background coloring left (negative) or right (positive) by the specified number of bars. |
| `editable` | input bool | `true` | If true, the setting can be edited in the style dialog. |
| `show_last` | input int | `na` | If set, only fills the last N bars. |
| `title` | const String | `na` | Title shown in the style dialog. |
| `display` | input PlotDisplay | `PlotDisplay.ALL` | Controls where the background is visible. |
| `force_overlay` | const bool | `na` | If true, forces display on the main chart pane. |
**See Also:** bar_color
---
### bool {#bool}
Converts the `x` value to a `bool` value.
**Parameters**
| Name | Type | Default | Description |
| --- | --- | --- | --- |
| `x` | int | | |
**Returns:** bool — `false` if x is `na`, `false`, or an `int`/`float` value equal to `0`. `true` for all other values.
Converts a float to bool; returns false if na or zero, true otherwise.
**Parameters**
| Name | Type | Default | Description |
| --- | --- | --- | --- |
| `x` | float | | |
**Returns:** bool
Converts a bool to bool; returns false if na, otherwise the value.
**Parameters**
| Name | Type | Default | Description |
| --- | --- | --- | --- |
| `x` | bool | | |
**Returns:** bool
Converts a value of any type to bool; returns false if na, true otherwise.
**Parameters**
| Name | Type | Default | Description |
| --- | --- | --- | --- |
| `x` | T | | |
**Returns:** bool
---
### box {#box}
```navi
box(x: Box): Box
```
Casts na to box type.
Useful for initializing box variables that will be assigned later.
**Parameters**
| Name | Type | Default | Description |
| --- | --- | --- | --- |
| `x` | Box | | |
**Returns:** Box
---
### color {#color}
```navi
color(x: Color): Color
```
Casts na to color
**Parameters**
| Name | Type | Default | Description |
| --- | --- | --- | --- |
| `x` | Color | | |
**Returns:** Color
---
### day_of_month {#fn-day_of_month}
```navi
day_of_month(timestamp: int, timezone: String = symbol_info.timezone): int
```
Extracts the day of month (1-31) from a UNIX timestamp in the specified timezone.
**Parameters**
| Name | Type | Default | Description |
| --- | --- | --- | --- |
| `timestamp` | int | | The UNIX timestamp in milliseconds. |
| `timezone` | String | `symbol_info.timezone` | The timezone for interpretation. Defaults to symbol's timezone. |
**Returns:** int
---
### day_of_week {#fn-day_of_week}
```navi
day_of_week(timestamp: int, timezone: String = symbol_info.timezone): DayOfWeek
```
Extracts the day of week from a UNIX timestamp in the specified timezone.
**Parameters**
| Name | Type | Default | Description |
| --- | --- | --- | --- |
| `timestamp` | int | | The UNIX timestamp in milliseconds. |
| `timezone` | String | `symbol_info.timezone` | The timezone for interpretation. Defaults to symbol's timezone. |
**Returns:** DayOfWeek — 1 (Sunday) through 7 (Saturday).
---
### fill {#fill}
Fills the area between two horizontal lines with a solid color.
Useful for creating visual zones (e.g., overbought/oversold regions).
**Parameters**
| Name | Type | Default | Description |
| --- | --- | --- | --- |
| `hline1` |
HLine | | The first horizontal line handle (from
hline). |
| `hline2` |
HLine | | The second horizontal line handle (from
hline). |
| `color` |
series Color | `Color.BLUE` | The fill color. |
| `title` |
const String | `na` | Title shown in the style dialog. |
| `editable` |
input bool | `true` | If true, the fill can be edited in the style dialog. |
| `fill_gaps` |
const bool | `false` | If true, fills gaps in the data. |
| `display` |
input PlotDisplay | `PlotDisplay.ALL` | Controls where the fill is visible. |
Fills the area between two plots with a solid color.
Useful for visualizing the difference or spread between two series.
**Parameters**
| Name | Type | Default | Description |
| --- | --- | --- | --- |
| `plot1` |
Plot | | The first plot handle (from
plot). |
| `plot2` |
Plot | | The second plot handle (from
plot). |
| `color` |
series Color | `Color.BLUE` | The fill color. |
| `title` |
const String | `na` | Title shown in the style dialog. |
| `editable` |
input bool | `true` | If true, the fill can be edited in the style dialog. |
| `show_last` |
input int | `na` | If set, only fills the last N bars. |
| `fill_gaps` |
const bool | `false` | If true, fills gaps in the data. |
| `display` |
input PlotDisplay | `PlotDisplay.ALL` | Controls where the fill is visible. |
Fills the area between two plots with a vertical gradient.
The gradient transitions from `top_color` at `top_value` to `bottom_color` at `bottom_value`, creating a smooth color transition based on price levels.
**Parameters**
| Name | Type | Default | Description |
| --- | --- | --- | --- |
| `plot1` |
Plot | | The first plot handle (from
plot). |
| `plot2` |
Plot | | The second plot handle (from
plot). |
| `top_value` |
series float | | The price level where the top color is applied. |
| `bottom_value` |
series float | | The price level where the bottom color is applied. |
| `top_color` |
series Color | `Color.BLUE` | The color at the top of the gradient. |
| `bottom_color` |
series Color | `#3a3c42` | The color at the bottom of the gradient. |
| `title` |
const String | `na` | Title shown in the style dialog. |
| `display` |
input PlotDisplay | `PlotDisplay.ALL` | Controls where the fill is visible. |
| `fill_gaps` |
const bool | `false` | If true, fills gaps in the data. |
| `editable` |
input bool | `true` | If true, the fill can be edited in the style dialog. |
series T | | The series value to process. |
**Returns:** series T — The current value if it is not `na`, otherwise the most recent non-na value, or `na` if no valid value has been seen yet.
**See Also:** na, nz
---
### float {#float}
Casts na to float
**Parameters**
| Name | Type | Default | Description |
| --- | --- | --- | --- |
| `x` | float | | |
**Returns:** float
Converts an int to float.
**Parameters**
| Name | Type | Default | Description |
| --- | --- | --- | --- |
| `x` | int | | |
**Returns:** float
---
### hline {#hline}
```navi
hline(
price: input float,
title: const String = na,
color: input Color = Color.BLUE,
line_style: input HLineStyle = HLineStyle.Dashed,
line_width: input int = 1,
editable: input bool = true,
display: input PlotDisplay = PlotDisplay.ALL
): HLine
```
Draws a horizontal line at a fixed price level across the entire chart.
Unlike plot, the price must be a constant or input value, not a series.
**Parameters**
| Name | Type | Default | Description |
| --- | --- | --- | --- |
| `price` | input float | | The price level where the line is drawn. |
| `title` | const String | `na` | Title shown in the style dialog. |
| `color` | input Color | `Color.BLUE` | Line color. |
| `line_style` | input HLineStyle | `HLineStyle.Dashed` | Line style: HLineStyle.Solid, HLineStyle.Dashed, HLineStyle.Dotted. |
| `line_width` | input int | `1` | Width of the line in pixels (1-4). |
| `editable` | input bool | `true` | If true, the line can be edited in the style dialog. |
| `display` | input PlotDisplay | `PlotDisplay.ALL` | Controls where the line is visible. |
**Returns:** HLine — An hline handle that can be used with fill.
**See Also:** fill, plot
---
### hour {#fn-hour}
```navi
hour(timestamp: int, timezone: String = symbol_info.timezone): int
```
Extracts the hour (0-23) from a UNIX timestamp in the specified timezone.
**Parameters**
| Name | Type | Default | Description |
| --- | --- | --- | --- |
| `timestamp` | int | | The UNIX timestamp in milliseconds. |
| `timezone` | String | `symbol_info.timezone` | The timezone for interpretation. Defaults to symbol's timezone. |
**Returns:** int
---
### indicator {#indicator}
```navi
indicator(
title: const String,
short_title: const String = na,
overlay: const bool = false,
format: const Format = Format.Inherit,
precision: const int = na,
scale: const ScaleType = na,
max_bars_back: const int = na,
timeframe: const String = na,
timeframe_gaps: const bool = true,
explicit_plot_zorder: const bool = false,
max_lines_count: const int = 50,
max_labels_count: const int = 50,
max_boxes_count: const int = 50,
calc_bars_count: const int = na,
max_polylines_count: const int = 50,
dynamic_requests: const bool = true,
behind_chart: const bool = true
)
```
Designates the script as an indicator and sets indicator-related properties.
**Parameters**
| Name | Type | Default | Description |
| --- | --- | --- | --- |
| `title` | const String | | The title of the script. It is displayed on the chart when no `short_title` argument is used, and becomes the publication's default title when publishing the script. |
| `short_title` | const String | `na` | The script's display name on charts. If specified, it will replace the `title` argument in most chart-related windows. |
| `overlay` | const bool | `false` | If `true`, the script's visuals appear on the main chart pane if the user adds it to the chart directly, or in another script's pane if the user applies it to that script. If `false`, the script's visuals appear in a separate pane. |
| `format` | const Format | `Format.Inherit` | Specifies the formatting of the script's displayed values. Possible values: Format.Inherit, Format.Price, Format.Volume, Format.Percent. Optional. |
| `precision` | const int | `na` | Specifies the number of digits after the floating point of the script's displayed values. Must be a non-negative integer no greater than 16. If `format` is set to Format.Inherit and `precision` is specified, the format will instead be set to Format.Price. When the function's `format` parameter uses Format.Volume, the `precision` parameter will not affect the result, as the decimal precision rules defined by Format.Volume supersede other precision settings. Optional. The default is inherited from the precision of the chart's symbol. |
| `scale` | const ScaleType | `na` | The price scale used. Possible values: ScaleType.Right, ScaleType.Left, ScaleType.None. The ScaleType.None value can only be applied in combination with `overlay = true`. Optional. By default, the script uses the same scale as the chart. Uses the ScaleType type. |
| `max_bars_back` | const int | `na` | The length of the historical buffer the script keeps for every variable and function, which determines how many past values can be referenced using the `[]` history-referencing operator. |
| `timeframe` | const String | `na` | Adds multi-timeframe functionality to simple scripts. |
| `timeframe_gaps` | const bool | `true` | Specifies how the indicator's values are displayed on chart bars when the timeframe is higher than the chart's. If `true`, a value only appears on a chart bar when the higher `timeframe` value becomes available, otherwise `na` is returned (thus a "gap" occurs). With `false`, what would otherwise be gaps are filled with the latest known value returned, avoiding `na` values. Optional. The default is `true`. |
| `explicit_plot_zorder` | const bool | `false` | Specifies the order in which the script's plots, fills, and hlines are rendered. If `true`, plots are drawn in the order in which they appear in the script's code, each newer plot being drawn above the previous ones. This only applies to `plot*()` functions, fill, and hline. |
| `max_lines_count` | const int | `50` | The number of last Line drawings displayed. Possible values: 1-500. The count is approximate; more drawings than the specified count may be displayed. |
| `max_labels_count` | const int | `50` | The number of last Label drawings displayed. Possible values: 1-500. The count is approximate; more drawings than the specified count may be displayed. |
| `max_boxes_count` | const int | `50` | The number of last Box drawings displayed. Possible values: 1-500. The count is approximate; more drawings than the specified count may be displayed. |
| `calc_bars_count` | const int | `na` | Limits the initial calculation of a script to the last number of bars specified. The default is `na`, in which case the script executes on all available bars. |
| `max_polylines_count` | const int | `50` | The number of last Polyline drawings displayed. Possible values: 1-100. The count is approximate; more drawings than the specified count may be displayed. |
| `dynamic_requests` | const bool | `true` | Specifies whether the script can dynamically call functions from the `request.*()` namespace. Dynamic `request.*()` calls are allowed within the local scopes of conditional structures (e.g., `if`), loops (e.g., `for`), and exported functions. Additionally, such calls allow "series" arguments for many of their parameters. |
| `behind_chart` | const bool | `true` | Controls whether all plots and drawings appear behind the chart display (if `true`) or in front of it (if `false`). This parameter only takes effect when the `overlay` parameter is `true`. |
**Examples**
```navi
// RSI indicator in a separate pane
indicator("My RSI", short_title: "RSI", overlay: false);
plot(ta.rsi(close, 14), title: "RSI");
```
```navi
// Overlay indicator on the price chart
indicator("EMA Cross", overlay: true);
plot(ta.ema(close, 9), color: Color.GREEN);
plot(ta.ema(close, 21), color: Color.RED);
```
---
### input {#input}
Creates an input value exposed in the script settings UI.
**Parameters**
| Name | Type | Default | Description |
| --- | --- | --- | --- |
| `defval` |
const int | | |
| `title` |
const String | `na` | |
| `tooltip` |
const String | `na` | |
| `inline` |
const String | `na` | |
| `group` |
const String | `na` | |
| `display` |
const PlotDisplay | `PlotDisplay.ALL` | |
| `active` |
input bool | `true` | |
**Returns:**
input int
Creates an input value exposed in the script settings UI.
**Parameters**
| Name | Type | Default | Description |
| --- | --- | --- | --- |
| `defval` |
const float | | |
| `title` |
const String | `na` | |
| `tooltip` |
const String | `na` | |
| `inline` |
const String | `na` | |
| `group` |
const String | `na` | |
| `display` |
const PlotDisplay | `PlotDisplay.ALL` | |
| `active` |
input bool | `true` | |
**Returns:**
input float
Creates an input value exposed in the script settings UI.
**Parameters**
| Name | Type | Default | Description |
| --- | --- | --- | --- |
| `defval` |
const bool | | |
| `title` |
const String | `na` | |
| `tooltip` |
const String | `na` | |
| `inline` |
const String | `na` | |
| `group` |
const String | `na` | |
| `display` |
const PlotDisplay | `PlotDisplay.ALL` | |
| `active` |
input bool | `true` | |
**Returns:**
input bool
Creates an input value exposed in the script settings UI.
**Parameters**
| Name | Type | Default | Description |
| --- | --- | --- | --- |
| `defval` |
const Color | | |
| `title` |
const String | `na` | |
| `tooltip` |
const String | `na` | |
| `inline` |
const String | `na` | |
| `group` |
const String | `na` | |
| `display` |
const PlotDisplay | `PlotDisplay.ALL` | |
| `active` |
input bool | `true` | |
**Returns:**
input Color
Creates an input value exposed in the script settings UI.
**Parameters**
| Name | Type | Default | Description |
| --- | --- | --- | --- |
| `defval` |
const String | | |
| `title` |
const String | `na` | |
| `tooltip` |
const String | `na` | |
| `inline` |
const String | `na` | |
| `group` |
const String | `na` | |
| `display` |
const PlotDisplay | `PlotDisplay.ALL` | |
| `active` |
input bool | `true` | |
**Returns:**
input String
Creates an input value exposed in the script settings UI.
**Parameters**
| Name | Type | Default | Description |
| --- | --- | --- | --- |
| `defval` |
const expression | | |
| `title` |
const String | `na` | |
| `tooltip` |
const String | `na` | |
| `inline` |
const String | `na` | |
| `group` |
const String | `na` | |
| `display` |
const PlotDisplay | `PlotDisplay.ALL` | |
| `active` |
input bool | `true` | |
**Returns:**
input float
Casts na to int
**Parameters**
| Name | Type | Default | Description |
| --- | --- | --- | --- |
| `x` | int | | |
**Returns:** int
Converts a float to int (truncates toward zero via math.floor).
**Parameters**
| Name | Type | Default | Description |
| --- | --- | --- | --- |
| `x` | float | | |
**Returns:** int
---
### label {#label}
```navi
label(x: Label): Label
```
Casts na to label type.
Useful for initializing label variables that will be assigned later.
**Parameters**
| Name | Type | Default | Description |
| --- | --- | --- | --- |
| `x` | Label | | |
**Returns:** Label
---
### library {#library}
```navi
library(
title: const String,
overlay: const bool = false,
dynamic_requests: const bool = true
)
```
Declaration statement identifying a script as a library.
**Parameters**
| Name | Type | Default | Description |
| --- | --- | --- | --- |
| `title` | const String | | The title of the library and its identifier. It cannot contain spaces, special characters or begin with a digit. It is used as the publication's default title, and to uniquely identify the library in the `import` statement, when another script uses it. It is also used as the script's name on the chart. |
| `overlay` | const bool | `false` | If `true`, any visuals produced by the library's exported functions are drawn on the main chart pane. If `false`, they appear in a separate pane. Optional. The default is `false`. |
| `dynamic_requests` | const bool | `true` | Specifies whether the library's exported functions may contain dynamic `request.*()` calls — i.e., calls placed inside conditional structures or loops, or calls that accept "series" arguments for parameters that normally require a simpler qualifier. Optional. The default is `true`. |
---
### line {#line}
```navi
line(x: Line): Line
```
Casts na to line type.
Useful for initializing line variables that will be assigned later.
**Parameters**
| Name | Type | Default | Description |
| --- | --- | --- | --- |
| `x` | Line | | |
**Returns:** Line
---
### line_fill {#line_fill}
```navi
line_fill(x: LineFill): LineFill
```
Casts na to linefill type.
Useful for initializing linefill variables that will be assigned later.
**Parameters**
| Name | Type | Default | Description |
| --- | --- | --- | --- |
| `x` | LineFill | | |
**Returns:** LineFill
---
### max_bars_back {#max_bars_back}
```navi
max_bars_back(variable: variableref, num: input int)
```
Declares how far back a variable is read, for the cases the compiler cannot work out on its own.
The engine sizes every history buffer to a depth it proves by reading the script, and reports that depth so a caller knows how many bars to fetch. Most scripts need nothing here. When the depth cannot be proved — an index computed from bar data, a length that is not linear in its inputs — the compiler says so, and only the minimum is retained; reads past it are `na`. This is where you say what it could not: a promise from the author, not a patch over a failed guess.
It also caps the variable at `num`, so declaring less than the script reads truncates it. Both effects are bounded by the engine's own limit; a declaration beyond that limit is reported rather than quietly cut.
`indicator(max_bars_back: N)` states the same thing for the whole script. Prefer this one: it names the series that needs the depth.
**Parameters**
| Name | Type | Default | Description |
| --- | --- | --- | --- |
| `variable` | variableref | | |
| `num` | input int | | Number of historical bars to keep available. May be derived from inputs (`max_bars_back(src, length + 32)`) — their values are known before the first bar, so the engine can still size to them. |
---
### minute {#fn-minute}
```navi
minute(timestamp: int, timezone: String = symbol_info.timezone): int
```
Extracts the minute (0-59) from a UNIX timestamp in the specified timezone.
**Parameters**
| Name | Type | Default | Description |
| --- | --- | --- | --- |
| `timestamp` | int | | The UNIX timestamp in milliseconds. |
| `timezone` | String | `symbol_info.timezone` | The timezone for interpretation. Defaults to symbol's timezone. |
**Returns:** int
---
### month {#fn-month}
```navi
month(timestamp: int, timezone: String = symbol_info.timezone): int
```
Extracts the month (1-12) from a UNIX timestamp in the specified timezone.
**Parameters**
| Name | Type | Default | Description |
| --- | --- | --- | --- |
| `timestamp` | int | | The UNIX timestamp in milliseconds. |
| `timezone` | String | `symbol_info.timezone` | The timezone for interpretation. Defaults to symbol's timezone. |
**Returns:** int
---
### na {#na}
```navi
na(value: any): bool
```
Tests if `value` is `na` (not available).
Essential for handling gaps in data, missing values in series, or uninitialized variables.
**Parameters**
| Name | Type | Default | Description |
| --- | --- | --- | --- |
| `value` | any | | The value to test. Can be any type. |
**Returns:** bool — `true` if the value is undefined or missing, `false` otherwise.
**See Also:** nz, fixnan
---
### nz {#nz}
Replaces `na` values with a specified replacement.
If `source` is not `na`, returns `source` unchanged. If `source` is `na`, returns `replacement`. Essential for ensuring calculations don't propagate `na` values.
**Parameters**
| Name | Type | Default | Description |
| --- | --- | --- | --- |
| `source` | T | | The value to check. |
| `replacement` | T | | The value to return if `source` is `na`. |
**Returns:** T
Replaces `na` integer values with a replacement (default 0).
Useful when you need a numeric fallback for missing integer data.
**Parameters**
| Name | Type | Default | Description |
| --- | --- | --- | --- |
| `source` | int | | The integer value to check. |
| `replacement` | int | `0` | The value to return if `source` is `na`. Defaults to 0. |
**Returns:** int
Replaces `na` float values with a replacement (default 0.0).
Useful when you need a numeric fallback for missing price or calculation data.
**Parameters**
| Name | Type | Default | Description |
| --- | --- | --- | --- |
| `source` | float | | The float value to check. |
| `replacement` | float | `0` | The value to return if `source` is `na`. Defaults to 0.0. |
**Returns:** float
Replaces `na` color values with a replacement (default black).
Useful when you need a visible fallback color for conditional coloring.
**Parameters**
| Name | Type | Default | Description |
| --- | --- | --- | --- |
| `source` |
Color | | The color value to check. |
| `replacement` |
Color | `#000000` | The value to return if `source` is `na`. Defaults to #000000. |
**Returns:**
Color
series float | | The series of values to plot. |
| `title` | const String | `na` | Title of the plot, shown in the style dialog and as a data window tooltip. |
| `color` | series Color | `Color.BLUE` | Color of the plotted element. |
| `line_width` | input int | `1` | Width of the plotted line, in pixels (1-4). |
| `style` | input PlotStyle | `PlotStyle.Line` | Plot style: PlotStyle.Line, PlotStyle.Histogram, PlotStyle.Area, PlotStyle.Columns, etc. |
| `track_price` | input bool | `false` | If true, a horizontal price line is shown at the last value. |
| `hist_base` | input float | `0` | The base value for histogram/columns style. Bars extend from this level to the series value. |
| `offset` | simple int | `0` | Shifts the plot left (negative) or right (positive) by the specified number of bars. |
| `join` | input bool | `false` | If true, connects gaps in the series with a line. |
| `editable` | input bool | `true` | If true, the plot style can be edited in the style dialog. |
| `show_last` | input int | `na` | If set, only the last N bars are displayed. |
| `display` | input PlotDisplay | `PlotDisplay.ALL` | Controls where the plot is displayed. Use PlotDisplay.ALL, PlotDisplay.NONE, PlotDisplay.PANE, PlotDisplay.PRICE_SCALE, etc. |
| `format` | input Format | `Format.Inherit` | Overrides the default number format for this plot in the data window. |
| `precision` | input int | `na` | Number of decimal places for display. |
| `force_overlay` | const bool | `na` | If true, forces the plot to display on the main chart pane. |
| `line_style` | input PlotStyle | `PlotStyle.Line` | Line style: PlotStyle.Line, PlotStyle.Stepline, PlotStyle.LineBr. |
**Returns:** Plot — A plot handle that can be used with fill to fill areas between plots.
**Examples**
```navi
// Plot a simple moving average
let smaLine = plot(ta.sma(close, 20), title: "SMA 20", color: Color.BLUE);
```
```navi
// Plot two EMAs and fill between them
let p1 = plot(ta.ema(close, 9), title: "EMA 9", color: Color.GREEN); let p2 =
plot(ta.ema(close, 21), title: "EMA 21", color: Color.RED); fill(p1, p2,
color: Color.new(Color.GRAY, 80));
```
**See Also:** fill, hline
---
### plot_arrow {#plot_arrow}
```navi
plot_arrow(
series: series float,
title: const String = na,
color_up: series Color = Color.BLUE,
color_down: series Color = Color.BLACK,
offset: simple int = 0,
min_height: input int = 5,
max_height: input int = 100,
editable: input bool = true,
show_last: input int = na,
display: input PlotDisplay = PlotDisplay.ALL,
format: input Format = Format.Inherit,
precision: input int = na,
force_overlay: const bool = na
)
```
Plots up and down arrows on the chart based on the sign of the series.
An up arrow is drawn when the value is positive, a down arrow when negative. The arrow height is proportional to the absolute value, scaled between `minheight` and `maxheight`. Useful for visualizing momentum or direction changes.
**Parameters**
| Name | Type | Default | Description |
| --- | --- | --- | --- |
| `series` | series float | | The data series. Positive values draw up arrows, negative draw down arrows. `na` or zero values draw nothing. |
| `title` | const String | `na` | Title shown in the style dialog and data window. |
| `color_up` | series Color | `Color.BLUE` | Color of up arrows. |
| `color_down` | series Color | `Color.BLACK` | Color of down arrows. |
| `offset` | simple int | `0` | Shifts arrows left (negative) or right (positive) by the specified bars. |
| `min_height` | input int | `5` | Minimum arrow height in pixels. |
| `max_height` | input int | `100` | Maximum arrow height in pixels. |
| `editable` | input bool | `true` | If true, the plot can be edited in the style dialog. |
| `show_last` | input int | `na` | If set, only shows arrows on the last N bars. |
| `display` | input PlotDisplay | `PlotDisplay.ALL` | Controls where arrows are displayed. |
| `format` | input Format | `Format.Inherit` | Overrides the default number format in the data window. |
| `precision` | input int | `na` | Number of decimal places for display. |
| `force_overlay` | const bool | `na` | If true, forces display on the main chart pane. |
**See Also:** plot_shape, plot_char
---
### plot_bar {#plot_bar}
```navi
plot_bar(
open: series float,
high: series float,
low: series float,
close: series float,
title: const String = na,
color: series Color = Color.BLUE,
editable: input bool = true,
show_last: input int = na,
display: input PlotDisplay = PlotDisplay.ALL,
format: input Format = Format.Inherit,
precision: input int = na,
force_overlay: const bool = na
)
```
Plots OHLC bars on the chart.
Each bar shows open, high, low, and close prices as a traditional bar chart element. Useful for overlaying custom OHLC data or displaying transformed price data.
**Parameters**
| Name | Type | Default | Description |
| --- | --- | --- | --- |
| `open` | series float | | The open price for each bar. |
| `high` | series float | | The high price for each bar. |
| `low` | series float | | The low price for each bar. |
| `close` | series float | | The close price for each bar. |
| `title` | const String | `na` | Title shown in the style dialog and data window. |
| `color` | series Color | `Color.BLUE` | Bar color. |
| `editable` | input bool | `true` | If true, the plot can be edited in the style dialog. |
| `show_last` | input int | `na` | If set, only shows the last N bars. |
| `display` | input PlotDisplay | `PlotDisplay.ALL` | Controls where bars are displayed. |
| `format` | input Format | `Format.Inherit` | Overrides the default number format in the data window. |
| `precision` | input int | `na` | Number of decimal places for display. |
| `force_overlay` | const bool | `na` | If true, forces display on the main chart pane. |
**See Also:** plot_candle
---
### plot_candle {#plot_candle}
```navi
plot_candle(
open: series float,
high: series float,
low: series float,
close: series float,
title: const String = na,
color: series Color = Color.BLUE,
wick_color: series Color = Color.BLUE,
editable: input bool = true,
show_last: input int = na,
border_color: series Color = Color.BLACK,
display: input PlotDisplay = PlotDisplay.ALL,
format: input Format = Format.Inherit,
precision: input int = na,
force_overlay: const bool = na
)
```
Plots candlesticks on the chart.
Each candle shows open, high, low, and close prices with a body and wicks. Useful for overlaying custom candlestick data (e.g., Heikin-Ashi) or displaying transformed price series.
**Parameters**
| Name | Type | Default | Description |
| --- | --- | --- | --- |
| `open` | series float | | The open price for each candle. |
| `high` | series float | | The high price for each candle. |
| `low` | series float | | The low price for each candle. |
| `close` | series float | | The close price for each candle. |
| `title` | const String | `na` | Title shown in the style dialog and data window. |
| `color` | series Color | `Color.BLUE` | Candle body color. |
| `wick_color` | series Color | `Color.BLUE` | Candle wick color. |
| `editable` | input bool | `true` | If true, the plot can be edited in the style dialog. |
| `show_last` | input int | `na` | If set, only shows the last N candles. |
| `border_color` | series Color | `Color.BLACK` | Candle body border color. |
| `display` | input PlotDisplay | `PlotDisplay.ALL` | Controls where candles are displayed. |
| `format` | input Format | `Format.Inherit` | Overrides the default number format in the data window. |
| `precision` | input int | `na` | Number of decimal places for display. |
| `force_overlay` | const bool | `na` | If true, forces display on the main chart pane. |
**See Also:** plot_bar
---
### plot_char {#plot_char}
Plots a character at each bar where the series has a non-na value.
The character is positioned relative to the bar based on `location`. Useful for marking specific events or conditions on the chart.
**Parameters**
| Name | Type | Default | Description |
| --- | --- | --- | --- |
| `series` |
series float | | The data series. A character is drawn when the value is not `na`. |
| `title` |
const String | `na` | Title shown in the style dialog and data window. |
| `char` |
input String | `"⭐"` | The character to display (Unicode supported). |
| `location` |
input Location | `Location.AboveBar` | Vertical position:
Location.AboveBar,
Location.BelowBar,
Location.Top,
Location.Bottom,
Location.Absolute. |
| `color` |
series Color | `Color.BLUE` | Character color. |
| `offset` |
simple int | `0` | Shifts the character left (negative) or right (positive) by bars. |
| `text` |
const String | `na` | Optional text displayed near the character. |
| `text_color` |
series Color | `Color.BLUE` | Color of the optional text. |
| `editable` |
input bool | `true` | If true, the plot can be edited in the style dialog. |
| `size` |
const Size | `Size.Auto` | Character size:
Size.Auto,
Size.Tiny,
Size.Small,
Size.Normal,
Size.Large,
Size.Huge. |
| `show_last` |
input int | `na` | If set, only shows characters on the last N bars. |
| `display` |
input PlotDisplay | `PlotDisplay.ALL` | Controls where characters are displayed. |
| `format` |
input Format | `Format.Inherit` | Overrides the default number format in the data window. |
| `precision` |
input int | `na` | Number of decimal places for display. |
| `force_overlay` |
const bool | `na` | If true, forces display on the main chart pane. |
Plots a character at each bar where the bool series is true.
A character is drawn when the value is `true`.
**Parameters**
| Name | Type | Default | Description |
| --- | --- | --- | --- |
| `series` |
series bool | | The boolean series. A character is drawn when true. |
| `title` |
const String | `na` | Title shown in the style dialog and data window. |
| `char` |
input String | `"⭐"` | The character to display (Unicode supported). |
| `location` |
input Location | `Location.AboveBar` | Vertical position:
Location.AboveBar,
Location.BelowBar,
Location.Top,
Location.Bottom,
Location.Absolute. |
| `color` |
series Color | `Color.BLUE` | Character color. |
| `offset` |
simple int | `0` | Shifts the character left (negative) or right (positive) by bars. |
| `text` |
const String | `na` | Optional text displayed near the character. |
| `text_color` |
series Color | `Color.BLUE` | Color of the optional text. |
| `editable` |
input bool | `true` | If true, the plot can be edited in the style dialog. |
| `size` |
const Size | `Size.Auto` | Character size:
Size.Auto,
Size.Tiny,
Size.Small,
Size.Normal,
Size.Large,
Size.Huge. |
| `show_last` |
input int | `na` | If set, only shows characters on the last N bars. |
| `display` |
input PlotDisplay | `PlotDisplay.ALL` | Controls where characters are displayed. |
| `format` |
input Format | `Format.Inherit` | Overrides the default number format in the data window. |
| `precision` |
input int | `na` | Number of decimal places for display. |
| `force_overlay` |
const bool | `na` | If true, forces display on the main chart pane. |
Plots a shape at each bar where the series has a non-na value.
Various shape styles are available (arrows, circles, crosses, etc.). The shape is positioned relative to the bar based on `location`.
**Parameters**
| Name | Type | Default | Description |
| --- | --- | --- | --- |
| `series` |
series float | | The data series. A shape is drawn when the value is not `na`. |
| `title` |
const String | `na` | Title shown in the style dialog and data window. |
| `style` |
input Shape | `Shape.XCross` | Shape style:
Shape.XCross,
Shape.Cross,
Shape.TriangleUp,
Shape.TriangleDown,
Shape.Flag,
Shape.Circle,
Shape.ArrowUp,
Shape.ArrowDown,
Shape.LabelUp,
Shape.LabelDown,
Shape.Square,
Shape.Diamond. |
| `location` |
input Location | `Location.AboveBar` | Vertical position:
Location.AboveBar,
Location.BelowBar,
Location.Top,
Location.Bottom,
Location.Absolute. |
| `color` |
series Color | `Color.BLUE` | Shape color. |
| `offset` |
simple int | `0` | Shifts the shape left (negative) or right (positive) by bars. |
| `text` |
const String | `na` | Optional text displayed near the shape. |
| `text_color` |
series Color | `Color.BLUE` | Color of the optional text. |
| `editable` |
input bool | `true` | If true, the plot can be edited in the style dialog. |
| `size` |
const Size | `Size.Auto` | Shape size:
Size.Auto,
Size.Tiny,
Size.Small,
Size.Normal,
Size.Large,
Size.Huge. |
| `show_last` |
input int | `na` | If set, only shows shapes on the last N bars. |
| `display` |
input PlotDisplay | `PlotDisplay.ALL` | Controls where shapes are displayed. |
| `format` |
input Format | `Format.Inherit` | Overrides the default number format in the data window. |
| `precision` |
input int | `na` | Number of decimal places for display. |
| `force_overlay` |
const bool | `na` | If true, forces display on the main chart pane. |
Plots a shape at each bar where the bool series is true.
A shape is drawn when the value is `true`.
**Parameters**
| Name | Type | Default | Description |
| --- | --- | --- | --- |
| `series` |
series bool | | The boolean series. A shape is drawn when true. |
| `title` |
const String | `na` | Title shown in the style dialog and data window. |
| `style` |
input Shape | `Shape.XCross` | Shape style:
Shape.XCross,
Shape.Cross,
Shape.TriangleUp,
Shape.TriangleDown,
Shape.Flag,
Shape.Circle,
Shape.ArrowUp,
Shape.ArrowDown,
Shape.LabelUp,
Shape.LabelDown,
Shape.Square,
Shape.Diamond. |
| `location` |
input Location | `Location.AboveBar` | Vertical position:
Location.AboveBar,
Location.BelowBar,
Location.Top,
Location.Bottom,
Location.Absolute. |
| `color` |
series Color | `Color.BLUE` | Shape color. |
| `offset` |
simple int | `0` | Shifts the shape left (negative) or right (positive) by bars. |
| `text` |
const String | `na` | Optional text displayed near the shape. |
| `text_color` |
series Color | `Color.BLUE` | Color of the optional text. |
| `editable` |
input bool | `true` | If true, the plot can be edited in the style dialog. |
| `size` |
const Size | `Size.Auto` | Shape size:
Size.Auto,
Size.Tiny,
Size.Small,
Size.Normal,
Size.Large,
Size.Huge. |
| `show_last` |
input int | `na` | If set, only shows shapes on the last N bars. |
| `display` |
input PlotDisplay | `PlotDisplay.ALL` | Controls where shapes are displayed. |
| `format` |
input Format | `Format.Inherit` | Overrides the default number format in the data window. |
| `precision` |
input int | `na` | Number of decimal places for display. |
| `force_overlay` |
const bool | `na` | If true, forces display on the main chart pane. |
int | | The UNIX timestamp in milliseconds. |
| `timezone` | String | `symbol_info.timezone` | The timezone for interpretation. Defaults to symbol's timezone. |
**Returns:** int
---
### strategy {#strategy}
```navi
strategy(
title: const String,
short_title: const String = na,
overlay: const bool = false,
format: const Format = Format.Inherit,
precision: const int = na,
scale: const ScaleType = na,
pyramiding: const int = 0,
calc_on_order_fills: const bool = false,
calc_on_every_tick: const bool = false,
max_bars_back: const int = na,
backtest_fill_limits_assumption: const int = 0,
default_qty_type: const DefaultQtyType = DefaultQtyType.Fixed,
default_qty_value: const float = 1,
initial_capital: const float = 1000000,
currency: simple String = symbol_info.currency,
slippage: const int = 0,
commission_type: const CommissionType = CommissionType.Percent,
commission_value: const float = 0,
process_orders_on_close: const bool = false,
close_entries_rule: const String = "FIFO",
margin_long: const float = 100,
margin_short: const float = 100,
explicit_plot_zorder: const bool = false,
max_lines_count: const int = 50,
max_labels_count: const int = 50,
max_boxes_count: const int = 50,
calc_bars_count: const int = na,
risk_free_rate: const float = 2,
use_bar_magnifier: const bool = false,
fill_orders_on_standard_ohlc: const bool = false,
max_polylines_count: const int = 50,
dynamic_requests: const bool = true,
behind_chart: const bool = true
)
```
Designates the script as a strategy and sets strategy-related properties.
**Parameters**
| Name | Type | Default | Description |
| --- | --- | --- | --- |
| `title` | const String | | The title of the script. Displayed on the chart when `short_title` is not set, and becomes the publication's default title when publishing. |
| `short_title` | const String | `na` | An abbreviated display name for the script shown on the chart and in most chart-related windows. Optional. |
| `overlay` | const bool | `false` | If `true`, the strategy's visuals are drawn on the main chart pane. If `false`, they appear in a separate pane. Optional. The default is `false`. |
| `format` | const Format | `Format.Inherit` | Specifies how the strategy's displayed values are formatted. Possible values: Format.Inherit, Format.Price, Format.Volume, Format.Percent. Optional. |
| `precision` | const int | `na` | Number of decimal digits shown for the strategy's displayed values. Must be a non-negative integer no greater than 16. When Format.Volume is used, this setting has no effect. Optional. The default is inherited from the chart symbol's precision. |
| `scale` | const ScaleType | `na` | The price scale to use. Possible values: ScaleType.Right, ScaleType.Left, ScaleType.None. ScaleType.None is only allowed when `overlay = true`. Optional. |
| `pyramiding` | const int | `0` | The maximum number of entries allowed in the same direction at the same time. Optional. The default is `0`, meaning only one entry per direction is permitted. |
| `calc_on_order_fills` | const bool | `false` | If `true`, the strategy recalculates its logic whenever an order is filled during a bar, rather than only at bar close. Optional. The default is `false`. |
| `calc_on_every_tick` | const bool | `false` | If `true`, the strategy may place orders on any incoming real-time price update (tick), so a condition met mid-bar acts on the next tick. If `false`, order placement is confined to the tick that closes a bar, which is the only one a historical bar has, so the strategy trades live the way it was backtested. Either way the script itself runs on every update, so plots and drawings follow the forming bar. Optional. The default is `false`. |
| `max_bars_back` | const int | `na` | The depth of the history buffer kept for all variables and functions, controlling how many past values can be read with the `[]` operator. Optional. |
| `backtest_fill_limits_assumption` | const int | `0` | The number of ticks beyond the limit price a market must move before a limit order is assumed to be filled. Optional. The default is `0`. |
| `default_qty_type` | const DefaultQtyType | `DefaultQtyType.Fixed` | Determines how `default_qty_value` is interpreted. Possible values: DefaultQtyType.Fixed, DefaultQtyType.PercentOfEquity, DefaultQtyType.Cash. Optional. The default is DefaultQtyType.Fixed. |
| `default_qty_value` | const float | `1` | The default order size used when no quantity is specified in an entry call. Its meaning depends on `default_qty_type`. Optional. The default is `1.0`. |
| `initial_capital` | const float | `1000000` | The starting capital available to the strategy at the beginning of the backtest, expressed in `currency`. Optional. The default is `1000000.0`. |
| `currency` | simple String | `symbol_info.currency` | The base currency in which the strategy tracks capital, profit, and loss. Optional. Defaults to the chart symbol's currency. |
| `slippage` | const int | `0` | The number of ticks added to each order fill price to simulate execution slippage. Optional. The default is `0`. |
| `commission_type` | const CommissionType | `CommissionType.Percent` | Specifies how trading commission is calculated. Possible values: `strategy.commission.percent`, `strategy.commission.cash_per_contract`, `strategy.commission.cash_per_order`. Optional. The default is `strategy.commission.percent`. |
| `commission_value` | const float | `0` | The commission amount, interpreted according to `commission_type`. Optional. The default is `0.0`. |
| `process_orders_on_close` | const bool | `false` | If `true`, orders generated during a bar are processed at that bar's closing price rather than on the opening of the next bar. Optional. The default is `false`. |
| `close_entries_rule` | const String | `"FIFO"` | The sequencing rule applied when closing multiple open entries. `"FIFO"` closes the oldest entry first; `"ANY"` allows the close call to target a specific entry by ID. Optional. The default is `"FIFO"`. |
| `margin_long` | const float | `100` | The margin requirement for long positions, expressed as a percentage of position value. A value of `100` means no leverage. Optional. The default is `100.0`. |
| `margin_short` | const float | `100` | The margin requirement for short positions, expressed as a percentage of position value. A value of `100` means no leverage. Optional. The default is `100.0`. |
| `explicit_plot_zorder` | const bool | `false` | If `true`, plots, fills, and hlines are rendered in the order they appear in the script code, with later declarations drawn on top of earlier ones. Optional. The default is `false`. |
| `max_lines_count` | const int | `50` | The maximum number of recent `line` drawings kept on the chart. Possible values: 1–500. Optional. The default is `50`. |
| `max_labels_count` | const int | `50` | The maximum number of recent `label` drawings kept on the chart. Possible values: 1–500. Optional. The default is `50`. |
| `max_boxes_count` | const int | `50` | The maximum number of recent `box` drawings kept on the chart. Possible values: 1–500. Optional. The default is `50`. |
| `calc_bars_count` | const int | `na` | Limits the backtest to the most recent number of bars specified. When `na`, the strategy runs on all available history. Optional. The default is `na`. |
| `risk_free_rate` | const float | `2` | The annual risk-free rate (as a percentage) used when computing the Sharpe and Sortino ratios. Optional. The default is `2.0`. |
| `use_bar_magnifier` | const bool | `false` | If `true`, the engine uses intrabar data at a finer resolution to determine more accurate order fill prices within each bar. Optional. The default is `false`. |
| `fill_orders_on_standard_ohlc` | const bool | `false` | If `true`, limit and stop orders are filled against the bar's standard OHLC prices, ignoring any intrabar price path. Optional. The default is `false`. |
| `max_polylines_count` | const int | `50` | The maximum number of recent `polyline` drawings kept on the chart. Possible values: 1–100. Optional. The default is `50`. |
| `dynamic_requests` | const bool | `true` | Specifies whether the strategy may contain dynamic `request.*()` calls inside conditional structures or loops, or calls that accept "series" arguments for normally non-series parameters. Optional. The default is `true`. |
| `behind_chart` | const bool | `true` | If `true`, all plots and drawings are rendered behind the chart's candlesticks or bars. Only takes effect when `overlay = true`. Optional. The default is `true`. |
---
### string {#string}
```navi
string(x: String): String
```
Casts na to String
**Parameters**
| Name | Type | Default | Description |
| --- | --- | --- | --- |
| `x` | String | | |
**Returns:** String
---
### table {#table}
```navi
table(x: Table): Table
```
Casts na to table type.
Useful for initializing table variables that will be assigned later.
**Parameters**
| Name | Type | Default | Description |
| --- | --- | --- | --- |
| `x` | Table | | |
**Returns:** Table
---
### time {#fn-time}
Resolves the opening timestamp of the bar bucket selected by `timeframe` and `session`.
This overload is convenient when you want the target session interpreted in a specific time zone.
**Parameters**
| Name | Type | Default | Description |
| --- | --- | --- | --- |
| `timeframe` |
series String | | Timeframe code such as `"D"`, `"60"`, or `"W"`. |
| `session` |
series String | `na` | Optional session window. When omitted, the symbol's regular session rules are used. |
| `timezone` |
series String | `symbol_info.timezone` | Time zone used when evaluating the session String. |
**Returns:**
series int — Millisecond timestamp for the matching bar start, or `na` when the current bar does not belong to the requested session.
Maps the current chart bar to another timeframe and returns that target bar's opening timestamp.
The lookup can be shifted first on the chart timeframe and then again on the target timeframe.
**Parameters**
| Name | Type | Default | Description |
| --- | --- | --- | --- |
| `timeframe` |
series String | | Destination timeframe. An empty String falls back to the chart timeframe. |
| `session` |
series String | `na` | Optional session filter for the destination lookup. |
| `bars_back` |
series int | `0` | Offset applied on the chart timeframe before mapping. |
| `timeframe_bars_back` |
series int | `0` | Extra offset applied after the destination bar is found. |
**Returns:**
series int
Resolves the closing timestamp of the bar bucket selected by `timeframe` and `session`.
**Parameters**
| Name | Type | Default | Description |
| --- | --- | --- | --- |
| `timeframe` |
series String | | Timeframe code such as `"D"`, `"60"`, or `"W"`. |
| `session` |
series String | `na` | Optional session window used during the lookup. |
| `timezone` |
series String | `symbol_info.timezone` | Time zone used when interpreting the session String. |
**Returns:**
series int — Millisecond timestamp for the matching bar close, or `na` when the current bar is outside the requested session.
Maps the current chart bar to another timeframe and returns that target bar's closing timestamp.
It uses the same two-stage offset model as
time, but reports the bar end instead of the bar start.
**Parameters**
| Name | Type | Default | Description |
| --- | --- | --- | --- |
| `timeframe` |
series String | | Destination timeframe. An empty String falls back to the chart timeframe. |
| `session` |
series String | `na` | Optional session filter for the destination lookup. |
| `bars_back` |
series int | `0` | Offset applied on the chart timeframe before mapping. |
| `timeframe_bars_back` |
series int | `0` | Extra offset applied after the destination bar is found. |
**Returns:**
series int
Parses a date/time String and returns the corresponding UNIX timestamp in milliseconds.
The String must be in ISO 8601 format (e.g., "2024-01-15" or "2024-01-15T09:30:00Z") or IETF RFC 2822 format.
**Parameters**
| Name | Type | Default | Description |
| --- | --- | --- | --- |
| `date_string` |
String | | The date/time String to parse. |
**Returns:**
int
Creates a UNIX timestamp from date/time components using the chart's timezone.
**Parameters**
| Name | Type | Default | Description |
| --- | --- | --- | --- |
| `year` | int | | The year (e.g., 2024). |
| `month` | int | | The month (1-12). |
| `day` | int | | The day of month (1-31). |
| `hour` | int | `0` | The hour (0-23). Defaults to 0. |
| `minute` | int | `0` | The minute (0-59). Defaults to 0. |
| `second` | int | `0` | The second (0-59). Defaults to 0. |
**Returns:** int — Milliseconds since 1970-01-01 00:00:00 UTC.
Creates a UNIX timestamp from date/time components in a specified timezone.
**Parameters**
| Name | Type | Default | Description |
| --- | --- | --- | --- |
| `timezone` |
String | `symbol_info.timezone` | The timezone (e.g., "America/New_York", "UTC", "GMT+8"). |
| `year` |
int | | The year (e.g., 2024). |
| `month` |
int | | The month (1-12). |
| `day` |
int | | The day of month (1-31). |
| `hour` |
int | `0` | The hour (0-23). Defaults to 0. |
| `minute` |
int | `0` | The minute (0-59). Defaults to 0. |
| `second` |
int | `0` | The second (0-59). Defaults to 0. |
**Returns:**
int — Milliseconds since 1970-01-01 00:00:00 UTC.
int | | The UNIX timestamp in milliseconds. |
| `timezone` | String | `symbol_info.timezone` | The timezone for interpretation. Defaults to symbol's timezone. |
**Returns:** int
---
### year {#fn-year}
```navi
year(timestamp: int, timezone: String = symbol_info.timezone): int
```
Extracts the year from a UNIX timestamp in the specified timezone.
**Parameters**
| Name | Type | Default | Description |
| --- | --- | --- | --- |
| `timestamp` | int | | The UNIX timestamp in milliseconds. |
| `timezone` | String | `symbol_info.timezone` | The timezone for interpretation. Defaults to symbol's timezone. |
**Returns:** int
---
# request
# request
## Functions
### currency_rate {#currency_rate}
```navi
currency_rate(
from: series String,
to: series String,
ignore_invalid_currency: series bool = false
): series float
```
Returns the exchange rate for converting one unit of `from` currency into `to` currency at the current bar. The rate is provided by the engine's DataProvider.
**Parameters**
| Name | Type | Default | Description |
| --- | --- | --- | --- |
| `from` | series String | | Source currency code, e.g. `"USD"` or `currency.USD`. |
| `to` | series String | | Target currency code, e.g. `"EUR"` or `currency.EUR`. |
| `ignore_invalid_currency` | series bool | `false` | If `true`, returns `na` when the conversion rate cannot be determined instead of raising a runtime error. |
**Returns:** series float
---
### data {#data}
```navi
data(
function: simple String,
args: series Map = na,
gaps: simple BarmergeGaps = BarmergeGaps.Off,
lookahead: simple BarmergeLookahead = BarmergeLookahead.Off
): series T
```
Calls a user-defined function on the engine's DataProvider and maps the resulting time-series onto the current chart bar. The result type is the generic argument `T` (`float`, `int`, `bool`, or `String`); the streamed value is coerced to `T` (numeric `int`/`float` convert, other cross-type mismatches raise a runtime error, `na` stays `na`). The `args` map accepts `bool`, `int`, `float`, and `String` values; other types cause a runtime error. `na` entries in the map are silently ignored. Returns `na` when no data is available.
**Parameters**
| Name | Type | Default | Description |
| --- | --- | --- | --- |
| `function` | simple String | | Name of the DataProvider function to call. |
| `args` | series Map<String, any> | `na` | Optional `Map<String, any>` of typed parameters passed to the function. |
| `gaps` | simple BarmergeGaps | `BarmergeGaps.Off` | Bar-mapping mode (see BarmergeGaps.Off / BarmergeGaps.On). |
| `lookahead` | simple BarmergeLookahead | `BarmergeLookahead.Off` | Controls lookahead semantics for backtesting correctness. |
**Returns:** series T
---
### dividends {#dividends}
```navi
dividends(
ticker: series String = symbol_info.tickerid,
field: series DividendsField = DividendsField.Gross,
gaps: simple BarmergeGaps = BarmergeGaps.Off,
lookahead: simple BarmergeLookahead = BarmergeLookahead.Off,
ignore_invalid_symbol: input bool = false,
currency: series String = symbol_info.currency
): series float
```
Queries the engine's DataProvider for a dividend value at the current bar. Supports lookahead control. Returns `na` when no data is available.
**Parameters**
| Name | Type | Default | Description |
| --- | --- | --- | --- |
| `ticker` | series String | `symbol_info.tickerid` | Ticker whose dividends to query; defaults to the chart symbol. |
| `field` | series DividendsField | `DividendsField.Gross` | Which dividend figure to retrieve: DividendsField.Gross (before withholding) or DividendsField.Net (after withholding). |
| `gaps` | simple BarmergeGaps | `BarmergeGaps.Off` | Bar-mapping mode (see BarmergeGaps.Off / BarmergeGaps.On). |
| `lookahead` | simple BarmergeLookahead | `BarmergeLookahead.Off` | Controls whether the value appears on the event bar itself (`lookahead_on`) or only after confirmation (`lookahead_off`). |
| `ignore_invalid_symbol` | input bool | `false` | When `true`, unrecognised tickers silently yield `na`. |
| `currency` | series String | `symbol_info.currency` | Currency code for value conversion. |
**Returns:** series float
---
### earnings {#earnings}
```navi
earnings(
ticker: series String = symbol_info.tickerid,
field: series EarningsField = EarningsField.Actual,
gaps: simple BarmergeGaps = BarmergeGaps.Off,
lookahead: simple BarmergeLookahead = BarmergeLookahead.Off,
ignore_invalid_symbol: input bool = false,
currency: series String = symbol_info.currency
): series float
```
Queries the engine's DataProvider for an earnings value at the current bar. Supports lookahead control for backtesting correctness. Returns `na` when no data is available.
**Parameters**
| Name | Type | Default | Description |
| --- | --- | --- | --- |
| `ticker` | series String | `symbol_info.tickerid` | Ticker whose earnings to query; defaults to the chart symbol. |
| `field` | series EarningsField | `EarningsField.Actual` | Which earnings figure to retrieve: EarningsField.Actual, EarningsField.Estimate, or EarningsField.Standardized. |
| `gaps` | simple BarmergeGaps | `BarmergeGaps.Off` | Bar-mapping mode (see BarmergeGaps.Off / BarmergeGaps.On). |
| `lookahead` | simple BarmergeLookahead | `BarmergeLookahead.Off` | When BarmergeLookahead.Off (default), a data point becomes visible only after a subsequent point confirms it, preventing future-leak in backtests. |
| `ignore_invalid_symbol` | input bool | `false` | When `true`, unrecognised tickers silently yield `na`. |
| `currency` | series String | `symbol_info.currency` | Currency code for value conversion. |
**Returns:** series float
---
### economic {#economic}
```navi
economic(
country_code: series String,
field: series String,
gaps: simple BarmergeGaps = BarmergeGaps.Off,
ignore_invalid_symbol: input bool = false
): series float
```
Queries the engine's DataProvider for a macroeconomic indicator value at the current bar. Returns `na` when no data is available.
**Parameters**
| Name | Type | Default | Description |
| --- | --- | --- | --- |
| `country_code` | series String | | ISO 3166-1 alpha-2 country code, e.g. `"US"`, `"CN"`. |
| `field` | series String | | Identifier of the economic indicator to retrieve. |
| `gaps` | simple BarmergeGaps | `BarmergeGaps.Off` | Bar-mapping mode (see BarmergeGaps.Off / BarmergeGaps.On). |
| `ignore_invalid_symbol` | input bool | `false` | When `true`, unrecognised identifiers silently yield `na`. |
**Returns:** series float
---
### financial {#financial}
```navi
financial(
symbol: series String,
financial_id: series String,
period: series String,
gaps: simple BarmergeGaps = BarmergeGaps.Off,
ignore_invalid_symbol: input bool = false,
currency: series String = symbol_info.currency
): series float
```
Queries the engine's DataProvider for a financial metric value at the current bar. The provider streams timestamped data points which the VM maps onto chart bars using the `gaps` mode. Returns `na` when no data is available.
**Parameters**
| Name | Type | Default | Description |
| --- | --- | --- | --- |
| `symbol` | series String | | Symbol whose financials to query. |
| `financial_id` | series String | | Identifier of the financial metric to retrieve. |
| `period` | series String | | Reporting period: `"FQ"` (quarterly) or `"FY"` (annual). |
| `gaps` | simple BarmergeGaps | `BarmergeGaps.Off` | Controls bar mapping when the data point does not align with a chart bar. BarmergeGaps.Off forward-fills; BarmergeGaps.On leaves gaps as `na`. |
| `ignore_invalid_symbol` | input bool | `false` | When `true`, unrecognised symbols silently yield `na`. |
| `currency` | series String | `symbol_info.currency` | Currency code for value conversion; defaults to the chart symbol's currency. |
**Returns:** series float
---
### security {#security}
```navi
security(
symbol: series String,
timeframe: series String,
expression: instructions,
gaps: simple BarmergeGaps = BarmergeGaps.Off,
lookahead: simple BarmergeLookahead = BarmergeLookahead.Off,
ignore_invalid_symbol: input bool = false,
currency: series String = na,
calc_bars_count: simple int = na
): series T
```
Evaluates `expression` on another symbol or timeframe and maps the result onto the current chart.
**Parameters**
| Name | Type | Default | Description |
| --- | --- | --- | --- |
| `symbol` | series String | | Symbol to request. |
| `timeframe` | series String | | Requested timeframe String, such as `"D"`, `"60"`, or `"W"`. |
| `expression` | instructions<T> | | Expression to execute in the requested context. |
| `gaps` | simple BarmergeGaps | `BarmergeGaps.Off` | How missing requested bars are mapped back onto the current chart. |
| `lookahead` | simple BarmergeLookahead | `BarmergeLookahead.Off` | Whether requested values may look ahead on historical bars. |
| `ignore_invalid_symbol` | input bool | `false` | If `true`, returns `na` for unknown symbols instead of raising an error. |
| `currency` | series String | `na` | Quote the requested series in this currency instead of the symbol's own. The data provider serves the converted bars, so `syminfo.currency` inside `expression` reports this one. |
| `calc_bars_count` | simple int | `na` | Optional positive limit on how many of the most recent historical bars to request. Those bars are all the data `expression` sees — it begins on the first of them — so a limit below what the expression reads back leaves its opening values unsettled. Read once, on the bar this call first runs on; changing it later has no effect. |
**Returns:** series T
**Examples**
```navi
// Get daily close of a different symbol on the current intraday chart let
dailyClose = request.security("AAPL", "D", close);
plot(dailyClose, title: "AAPL Daily Close");
```
```navi
// Request daily high and low simultaneously using a tuple expression let
(dHigh, dLow) = request.security("AAPL", "D", (high, low));
plot(dHigh, title: "Daily High", color: Color.GREEN);
plot(dLow, title: "Daily Low", color: Color.RED);
```
---
### security_lower_tf {#security_lower_tf}
```navi
security_lower_tf(
symbol: series String,
timeframe: series String,
expression: instructions,
ignore_invalid_symbol: input bool = false,
currency: series String = na,
ignore_invalid_timeframe: input bool = false,
calc_bars_count: simple int = na
): series Array
```
Evaluates `expression` on a lower timeframe and returns one array element per lower-timeframe bar inside the current chart bar.
**Parameters**
| Name | Type | Default | Description |
| --- | --- | --- | --- |
| `symbol` | series String | | Symbol to request. |
| `timeframe` | series String | | Lower or equal timeframe String, such as `"1"` or `"5"`. |
| `expression` | instructions<T> | | Expression to evaluate for each lower-timeframe bar. |
| `ignore_invalid_symbol` | input bool | `false` | If `true`, returns `na` for unknown symbols instead of raising an error. |
| `currency` | series String | `na` | Quote the requested intrabars in this currency instead of the symbol's own. The data provider serves the converted bars. |
| `ignore_invalid_timeframe` | input bool | `false` | If `true`, returns `na` when the requested timeframe is not lower than the chart timeframe. |
| `calc_bars_count` | simple int | `na` | Optional positive limit on how many of the most recent historical intrabars to request. Those intrabars are all the data `expression` sees — it begins on the first of them. Read once, on the bar this call first runs on; changing it later has no effect. |
**Returns:** series Array<T>
---
### splits {#splits}
```navi
splits(
ticker: series String = symbol_info.tickerid,
field: series SplitsField = SplitsField.Denominator,
gaps: simple BarmergeGaps = BarmergeGaps.Off,
lookahead: simple BarmergeLookahead = BarmergeLookahead.Off,
ignore_invalid_symbol: input bool = false
): series float
```
Queries the engine's DataProvider for a stock-split value at the current bar. Supports lookahead control. Returns `na` when no data is available.
**Parameters**
| Name | Type | Default | Description |
| --- | --- | --- | --- |
| `ticker` | series String | `symbol_info.tickerid` | Ticker whose splits to query; defaults to the chart symbol. |
| `field` | series SplitsField | `SplitsField.Denominator` | Which component of the split ratio to retrieve: SplitsField.Numerator or SplitsField.Denominator. |
| `gaps` | simple BarmergeGaps | `BarmergeGaps.Off` | Bar-mapping mode (see BarmergeGaps.Off / BarmergeGaps.On). |
| `lookahead` | simple BarmergeLookahead | `BarmergeLookahead.Off` | Controls whether the value appears on the event bar itself (`lookahead_on`) or only after confirmation (`lookahead_off`). |
| `ignore_invalid_symbol` | input bool | `false` | When `true`, unrecognised tickers silently yield `na`. |
**Returns:** series float
---
# runtime
# runtime
## Functions
### error {#error}
```navi
error(message: series String)
```
When called, raises a runtime error with the given message.
**Parameters**
| Name | Type | Default | Description |
| --- | --- | --- | --- |
| `message` | series String | | |
---
# session
# session
## Properties
### is_first_bar {#is_first_bar}
**Type:** series bool
Returns `true` if the current bar is the first bar of the day's session, `false` otherwise.
---
### is_first_bar_regular {#is_first_bar_regular}
**Type:** series bool
Returns `true` on the first regular session bar of the day, `false` otherwise.
---
### is_last_bar {#is_last_bar}
**Type:** series bool
Returns `true` if the current bar is the last bar of the day's session, `false` otherwise.
---
### is_last_bar_regular {#is_last_bar_regular}
**Type:** series bool
Returns `true` on the last regular session bar of the day, `false` otherwise.
---
### is_market {#is_market}
**Type:** series bool
Returns `true` if the current bar is a part of the regular trading hours (i.e. market hours), `false` otherwise.
---
### is_postmarket {#is_postmarket}
**Type:** series bool
Returns `true` if the current bar is a part of the post-market, `false` otherwise.
---
### is_premarket {#is_premarket}
**Type:** series bool
Returns `true` if the current bar is a part of the pre-market, `false` otherwise.
---
# strategy
# strategy
## Properties
### account_currency {#account_currency}
**Type:** series String
Returns the currency code used for the strategy's account, as set in the strategy declaration.
---
### avg_losing_trade {#avg_losing_trade}
**Type:** series float
Returns the average loss per losing trade in account currency.
Calculated as gross loss / number of losing trades. Expressed as a positive number.
---
### avg_losing_trade_percent {#avg_losing_trade_percent}
**Type:** series float
Returns the average loss per losing trade as a percentage of initial capital.
Calculated as gross loss percent / number of losing trades. Expressed as a positive number.
---
### avg_trade {#avg_trade}
**Type:** series float
Returns the average profit/loss per closed trade in account currency.
Calculated as net profit / number of closed trades.
---
### avg_trade_percent {#avg_trade_percent}
**Type:** series float
Returns the average profit/loss per closed trade as a percentage of initial capital.
Calculated as net profit percent / number of closed trades.
---
### avg_winning_trade {#avg_winning_trade}
**Type:** series float
Returns the average profit per winning trade in account currency.
Calculated as gross profit / number of winning trades.
---
### avg_winning_trade_percent {#avg_winning_trade_percent}
**Type:** series float
Returns the average profit per winning trade as a percentage of initial capital.
Calculated as gross profit percent / number of winning trades.
---
### closed_trades {#closed_trades}
**Type:** series int
Returns the count of closed trades since strategy start.
A trade is counted as closed when an entry is fully exited. Use `strategy.closedtrades.*` functions to access details of individual closed trades.
---
### default_entry_qty {#default_entry_qty}
**Type:** series float
Returns the default number of contracts/shares/lots/units used for market orders.
Calculated from the `default_qty_type` and `default_qty_value` parameters of the strategy declaration. The value depends on the current price and equity.
---
### equity {#equity}
**Type:** series float
Returns the current account equity: initial capital + net profit + open profit.
This is the real-time value of the account including unrealized gains/losses from open positions.
---
### even_trades {#even_trades}
**Type:** series int
Returns the number of break-even closed trades.
A trade is considered even when its profit is exactly zero.
---
### gross_loss {#gross_loss}
**Type:** series float
Returns the gross loss: the sum of losses from all losing closed trades.
Expressed as a positive number. In account currency.
---
### gross_loss_percent {#gross_loss_percent}
**Type:** series float
Returns the gross loss as a percentage of initial capital.
Calculated as (gross loss / initial capital) * 100.
---
### gross_profit {#gross_profit}
**Type:** series float
Returns the gross profit: the sum of profits from all winning closed trades.
Does not subtract losses. In account currency.
---
### gross_profit_percent {#gross_profit_percent}
**Type:** series float
Returns the gross profit as a percentage of initial capital.
Calculated as (gross profit / initial capital) * 100.
---
### initial_capital {#initial_capital}
**Type:** series float
Returns the initial capital set in the strategy declaration.
This is the starting cash for backtests, as specified by the `initial_capital` parameter.
---
### loss_trades {#loss_trades}
**Type:** series int
Returns the number of losing closed trades.
A trade is considered losing when its profit is less than zero.
---
### margin_liquidation_price {#margin_liquidation_price}
**Type:** series float
Returns the price at which a margin call will be triggered for the current position.
---
### max_contracts_held_all {#max_contracts_held_all}
**Type:** series float
Returns the maximum number of contracts/shares/lots/units held at any one time during the strategy.
Considers both long and short directions (whichever was larger).
---
### max_contracts_held_long {#max_contracts_held_long}
**Type:** series float
Returns the maximum number of contracts/shares/lots/units held in a long position at any one time during the strategy.
---
### max_contracts_held_short {#max_contracts_held_short}
**Type:** series float
Returns the maximum number of contracts/shares/lots/units held in a short position at any one time during the strategy.
---
### max_drawdown {#max_drawdown}
**Type:** series float
Returns the maximum drawdown: the largest peak-to-trough decline in equity during the strategy's history.
In account currency. A key risk metric showing the worst loss from a peak.
---
### max_drawdown_percent {#max_drawdown_percent}
**Type:** series float
Returns the maximum drawdown as a percentage of equity at the peak.
A drawdown of 20% means equity fell 20% from its highest point.
---
### max_runup {#max_runup}
**Type:** series float
Returns the maximum run-up: the largest peak-to-trough rise in equity during the strategy's history.
In account currency. Represents the best unrealized gain achieved.
---
### max_runup_percent {#max_runup_percent}
**Type:** series float
Returns the maximum run-up as a percentage of equity at the trough.
---
### net_profit {#net_profit}
**Type:** series float
Returns the net profit in the account currency.
This is the sum of all realized profits and losses from closed trades. Does not include open profit.
---
### net_profit_percent {#net_profit_percent}
**Type:** series float
Returns the net profit as a percentage of initial capital.
Calculated as (net profit / initial capital) * 100.
---
### open_profit {#open_profit}
**Type:** series float
Returns the current unrealized profit/loss from open positions in account currency.
Positive when positions are profitable, negative when at a loss. This value fluctuates with price movements.
---
### open_profit_percent {#open_profit_percent}
**Type:** series float
Returns the current unrealized profit/loss as a percentage of initial capital.
Calculated as (open profit / initial capital) * 100.
---
### open_trades {#open_trades}
**Type:** series int
Returns the count of currently open trades.
Positions that have been entered but not yet fully closed. Use `strategy.opentrades.*` functions to access details of individual open trades.
---
### position_avg_price {#position_avg_price}
**Type:** series float
Returns the quantity-weighted average entry price of the current open position.
Calculated as the sum of (entry_price × quantity) for all open trades divided by the total quantity. Returns `na` when flat.
---
### position_entry_name {#position_entry_name}
**Type:** series String
Returns the entry ID of the first open trade in the current position.
---
### position_size {#position_size}
**Type:** series float
Returns the current position size in units (contracts, shares, etc.).
Positive values indicate a long position, negative values indicate a short position, and zero means flat (no position).
---
### win_trades {#win_trades}
**Type:** series int
Returns the number of winning closed trades.
A trade is considered winning when its profit is greater than zero.
## Functions
### cancel {#cancel}
```navi
cancel(id: series String)
```
Cancels a pending order by ID.
**Parameters**
| Name | Type | Default | Description |
| --- | --- | --- | --- |
| `id` | series String | | Order identifier to cancel. |
---
### cancel_all {#cancel_all}
```navi
cancel_all()
```
Cancels every pending order created by the strategy.
---
### close {#close}
```navi
close(
id: series String,
comment: series String = na,
qty: series float = na,
qty_percent: series float = na,
alert_message: series String = na,
immediately: series bool = false,
disable_alert: series bool = false
)
```
Closes an open position by entry ID.
Use either `qty` or `qty_percent` to request a partial close.
**Parameters**
| Name | Type | Default | Description |
| --- | --- | --- | --- |
| `id` | series String | | Entry ID to close. |
| `comment` | series String | `na` | Optional comment for the generated close order. |
| `qty` | series float | `na` | Absolute quantity to close. |
| `qty_percent` | series float | `na` | Percentage of the position to close. |
| `alert_message` | series String | `na` | Optional alert message. |
| `immediately` | series bool | `false` | If `true`, closes the position immediately. |
| `disable_alert` | series bool | `false` | If `true`, suppresses the strategy alert. |
---
### close_all {#close_all}
```navi
close_all(
comment: series String = na,
alert_message: series String = na,
immediately: series bool = false,
disable_alert: series bool = false
)
```
Closes every open position.
**Parameters**
| Name | Type | Default | Description |
| --- | --- | --- | --- |
| `comment` | series String | `na` | Optional comment for the generated close orders. |
| `alert_message` | series String | `na` | Optional alert message. |
| `immediately` | series bool | `false` | If `true`, closes all positions immediately. |
| `disable_alert` | series bool | `false` | If `true`, suppresses the strategy alert. |
---
### convert_to_account {#convert_to_account}
```navi
convert_to_account(value: series float): series float
```
Converts a monetary value from the symbol's currency to the strategy's account currency.
Uses the configured currency converter. When no converter is provided, returns the value unchanged.
**Parameters**
| Name | Type | Default | Description |
| --- | --- | --- | --- |
| `value` | series float | | The value in the symbol's currency. |
**Returns:** series float
---
### convert_to_symbol {#convert_to_symbol}
```navi
convert_to_symbol(value: series float): series float
```
Converts a monetary value from the strategy's account currency to the symbol's currency.
Uses the configured currency converter. When no converter is provided, returns the value unchanged.
**Parameters**
| Name | Type | Default | Description |
| --- | --- | --- | --- |
| `value` | series float | | The value in the account currency. |
**Returns:** series float
---
### entry {#entry}
```navi
entry(
id: series String,
direction: series Direction,
qty: series float = na,
limit: series float = na,
stop: series float = na,
oca_name: series String = na,
oca_type: series OcaType = OcaType.None,
comment: series String = na,
alert_message: series String = na,
disable_alert: series bool = false
)
```
Places or updates an entry order.
Reusing an existing pending `id` updates that order instead of creating a new one.
**Parameters**
| Name | Type | Default | Description |
| --- | --- | --- | --- |
| `id` | series String | | Unique order identifier. |
| `direction` | series Direction | | Order side: Direction.Long or Direction.Short. |
| `qty` | series float | `na` | Order size. When `na`, the strategy default is used. |
| `limit` | series float | `na` | Limit price. When `na`, the order is not limited. |
| `stop` | series float | `na` | Stop price. When `na`, no stop trigger is attached. |
| `oca_name` | series String | `na` | Optional One-Cancels-All group name. |
| `oca_type` | series OcaType | `OcaType.None` | OCA behavior, such as `oca.cancel`, `oca.reduce`, or `oca.none`. |
| `comment` | series String | `na` | Optional order comment. |
| `alert_message` | series String | `na` | Optional alert message for this order. |
| `disable_alert` | series bool | `false` | If `true`, suppresses the strategy alert for this order. |
---
### exit {#exit}
```navi
exit(
id: series String,
from_entry: series String = na,
qty: series float = na,
qty_percent: series float = na,
profit: series float = na,
limit: series float = na,
loss: series float = na,
stop: series float = na,
trail_price: series float = na,
trail_points: series float = na,
trail_offset: series float = na,
oca_name: series String = na,
comment: series String = na,
comment_profit: series String = na,
comment_loss: series String = na,
comment_trailing: series String = na,
alert_message: series String = na,
alert_profit: series String = na,
alert_loss: series String = na,
alert_trailing: series String = na,
disable_alert: series bool = false
)
```
Places or updates an exit order for an open position.
The order can combine take-profit, stop-loss, and trailing-stop settings. If both take-profit and stop-loss values are supplied, they behave as a bracket.
**Parameters**
| Name | Type | Default | Description |
| --- | --- | --- | --- |
| `id` | series String | | Unique exit-order identifier. |
| `from_entry` | series String | `na` | Entry ID to exit. When `na`, the exit applies to the whole matching position. |
| `qty` | series float | `na` | Absolute quantity to close. When `na`, the full matched quantity is used. |
| `qty_percent` | series float | `na` | Percentage of the position to close. |
| `profit` | series float | `na` | Take-profit distance in ticks from the entry price. |
| `limit` | series float | `na` | Absolute take-profit price. Overrides `profit`. |
| `loss` | series float | `na` | Stop-loss distance in ticks from the entry price. |
| `stop` | series float | `na` | Absolute stop-loss price. Overrides `loss`. |
| `trail_price` | series float | `na` | Absolute price that activates the trailing stop. |
| `trail_points` | series float | `na` | Tick distance from entry that activates the trailing stop. |
| `trail_offset` | series float | `na` | Tick offset maintained behind the best price after activation. |
| `oca_name` | series String | `na` | Optional OCA group name. |
| `comment` | series String | `na` | Default comment for fills from this exit. |
| `comment_profit` | series String | `na` | Comment used for take-profit fills. |
| `comment_loss` | series String | `na` | Comment used for stop-loss fills. |
| `comment_trailing` | series String | `na` | Comment used for trailing-stop fills. |
| `alert_message` | series String | `na` | Default alert message. |
| `alert_profit` | series String | `na` | Alert message used for take-profit fills. |
| `alert_loss` | series String | `na` | Alert message used for stop-loss fills. |
| `alert_trailing` | series String | `na` | Alert message used for trailing-stop fills. |
| `disable_alert` | series bool | `false` | If `true`, suppresses the strategy alert for this exit. |
---
### order {#order}
```navi
order(
id: series String,
direction: series Direction,
qty: series float = na,
limit: series float = na,
stop: series float = na,
oca_name: series String = na,
oca_type: series OcaType = OcaType.None,
comment: series String = na,
alert_message: series String = na,
disable_alert: series bool = false
)
```
Places or updates a general strategy order.
This API can open, add to, reduce, or close a position depending on the current position and arguments.
**Parameters**
| Name | Type | Default | Description |
| --- | --- | --- | --- |
| `id` | series String | | Unique order identifier. |
| `direction` | series Direction | | Order side: Direction.Long or Direction.Short. |
| `qty` | series float | `na` | Order size. When `na`, the strategy default is used. |
| `limit` | series float | `na` | Limit price. When `na`, the order is not limited. |
| `stop` | series float | `na` | Stop price. When `na`, no stop trigger is attached. |
| `oca_name` | series String | `na` | Optional One-Cancels-All group name. |
| `oca_type` | series OcaType | `OcaType.None` | OCA behavior, such as `oca.cancel`, `oca.reduce`, or `oca.none`. |
| `comment` | series String | `na` | Optional order comment. |
| `alert_message` | series String | `na` | Optional alert message for this order. |
| `disable_alert` | series bool | `false` | If `true`, suppresses the strategy alert for this order. |
---
# strategy.closed_trades
# strategy.closed_trades
## Properties
### first_index {#first_index}
**Type:** series int
Returns the bar index of the first closed trade, usually 0.
## Functions
### commission {#commission}
```navi
commission(trade_num: int): series float
```
Returns the sum of entry and exit fees paid in the closed trade, expressed in `strategy.account_currency`.
**Parameters**
| Name | Type | Default | Description |
| --- | --- | --- | --- |
| `trade_num` | int | | |
**Returns:** series float
---
### entry_bar_index {#entry_bar_index}
```navi
entry_bar_index(trade_num: int): series int
```
Returns the bar index of the entry bar of the closed trade.
**Parameters**
| Name | Type | Default | Description |
| --- | --- | --- | --- |
| `trade_num` | int | | |
**Returns:** series int
---
### entry_comment {#entry_comment}
```navi
entry_comment(trade_num: int): series String
```
Returns the comment of the entry order of the closed trade.
**Parameters**
| Name | Type | Default | Description |
| --- | --- | --- | --- |
| `trade_num` | int | | |
**Returns:** series String
---
### entry_id {#entry_id}
```navi
entry_id(trade_num: int): series String
```
Returns the entry order ID of the closed trade.
**Parameters**
| Name | Type | Default | Description |
| --- | --- | --- | --- |
| `trade_num` | int | | |
**Returns:** series String
---
### entry_price {#entry_price}
```navi
entry_price(trade_num: int): series float
```
Returns the entry price of the closed trade.
**Parameters**
| Name | Type | Default | Description |
| --- | --- | --- | --- |
| `trade_num` | int | | |
**Returns:** series float
---
### entry_time {#entry_time}
```navi
entry_time(trade_num: int): series int
```
Returns the entry time of the closed trade, in UNIX time (milliseconds).
**Parameters**
| Name | Type | Default | Description |
| --- | --- | --- | --- |
| `trade_num` | int | | |
**Returns:** series int
---
### exit_bar_index {#exit_bar_index}
```navi
exit_bar_index(trade_num: int): series int
```
Returns the bar index of the exit bar of the closed trade.
**Parameters**
| Name | Type | Default | Description |
| --- | --- | --- | --- |
| `trade_num` | int | | |
**Returns:** series int
---
### exit_comment {#exit_comment}
```navi
exit_comment(trade_num: int): series String
```
Returns the comment of the exit order of the closed trade.
**Parameters**
| Name | Type | Default | Description |
| --- | --- | --- | --- |
| `trade_num` | int | | |
**Returns:** series String
---
### exit_id {#exit_id}
```navi
exit_id(trade_num: int): series String
```
Returns the exit order ID of the closed trade.
**Parameters**
| Name | Type | Default | Description |
| --- | --- | --- | --- |
| `trade_num` | int | | |
**Returns:** series String
---
### exit_price {#exit_price}
```navi
exit_price(trade_num: int): series float
```
Returns the exit price of the closed trade.
**Parameters**
| Name | Type | Default | Description |
| --- | --- | --- | --- |
| `trade_num` | int | | |
**Returns:** series float
---
### exit_time {#exit_time}
```navi
exit_time(trade_num: int): series int
```
Returns the exit time of the closed trade, in UNIX time (milliseconds).
**Parameters**
| Name | Type | Default | Description |
| --- | --- | --- | --- |
| `trade_num` | int | | |
**Returns:** series int
---
### max_drawdown {#max_drawdown}
```navi
max_drawdown(trade_num: int): series float
```
Returns the maximum drawdown (in `strategy.account_currency`) during the closed trade.
**Parameters**
| Name | Type | Default | Description |
| --- | --- | --- | --- |
| `trade_num` | int | | |
**Returns:** series float
---
### max_drawdown_percent {#max_drawdown_percent}
```navi
max_drawdown_percent(trade_num: int): series float
```
Returns the maximum drawdown (percent) during the closed trade.
**Parameters**
| Name | Type | Default | Description |
| --- | --- | --- | --- |
| `trade_num` | int | | |
**Returns:** series float
---
### max_runup {#max_runup}
```navi
max_runup(trade_num: int): series float
```
Returns the maximum run-up (in `strategy.account_currency`) during the closed trade.
**Parameters**
| Name | Type | Default | Description |
| --- | --- | --- | --- |
| `trade_num` | int | | |
**Returns:** series float
---
### max_runup_percent {#max_runup_percent}
```navi
max_runup_percent(trade_num: int): series float
```
Returns the maximum run-up (percent) during the closed trade.
**Parameters**
| Name | Type | Default | Description |
| --- | --- | --- | --- |
| `trade_num` | int | | |
**Returns:** series float
---
### profit {#profit}
```navi
profit(trade_num: int): series float
```
Returns the profit/loss (in `strategy.account_currency`) of the closed trade.
**Parameters**
| Name | Type | Default | Description |
| --- | --- | --- | --- |
| `trade_num` | int | | |
**Returns:** series float
---
### profit_percent {#profit_percent}
```navi
profit_percent(trade_num: int): series float
```
Returns the profit/loss (percent) of the closed trade.
**Parameters**
| Name | Type | Default | Description |
| --- | --- | --- | --- |
| `trade_num` | int | | |
**Returns:** series float
---
### size {#size}
```navi
size(trade_num: int): series float
```
Returns the size (quantity) of the closed trade.
**Parameters**
| Name | Type | Default | Description |
| --- | --- | --- | --- |
| `trade_num` | int | | |
**Returns:** series float
---
# strategy.open_trades
# strategy.open_trades
## Properties
### capital_held {#capital_held}
**Type:** series float
Returns the capital amount currently held by open trades.
## Functions
### commission {#commission}
```navi
commission(trade_num: int): series float
```
Returns the sum of entry and exit fees paid in the open trade, expressed in `strategy.account_currency`.
**Parameters**
| Name | Type | Default | Description |
| --- | --- | --- | --- |
| `trade_num` | int | | |
**Returns:** series float
---
### entry_bar_index {#entry_bar_index}
```navi
entry_bar_index(trade_num: int): series int
```
Returns the bar index of the entry bar of the open trade.
**Parameters**
| Name | Type | Default | Description |
| --- | --- | --- | --- |
| `trade_num` | int | | |
**Returns:** series int
---
### entry_comment {#entry_comment}
```navi
entry_comment(trade_num: int): series String
```
Returns the comment of the entry order of the open trade.
**Parameters**
| Name | Type | Default | Description |
| --- | --- | --- | --- |
| `trade_num` | int | | |
**Returns:** series String
---
### entry_id {#entry_id}
```navi
entry_id(trade_num: int): series String
```
Returns the entry order ID of the open trade.
**Parameters**
| Name | Type | Default | Description |
| --- | --- | --- | --- |
| `trade_num` | int | | |
**Returns:** series String
---
### entry_price {#entry_price}
```navi
entry_price(trade_num: int): series float
```
Returns the entry price of the open trade.
**Parameters**
| Name | Type | Default | Description |
| --- | --- | --- | --- |
| `trade_num` | int | | |
**Returns:** series float
---
### entry_time {#entry_time}
```navi
entry_time(trade_num: int): series int
```
Returns the entry time of the open trade, in UNIX time (milliseconds).
**Parameters**
| Name | Type | Default | Description |
| --- | --- | --- | --- |
| `trade_num` | int | | |
**Returns:** series int
---
### max_drawdown {#max_drawdown}
```navi
max_drawdown(trade_num: int): series float
```
Returns the maximum drawdown (in `strategy.account_currency`) of the open trade.
**Parameters**
| Name | Type | Default | Description |
| --- | --- | --- | --- |
| `trade_num` | int | | |
**Returns:** series float
---
### max_drawdown_percent {#max_drawdown_percent}
```navi
max_drawdown_percent(trade_num: int): series float
```
Returns the maximum drawdown (percent) of the open trade.
**Parameters**
| Name | Type | Default | Description |
| --- | --- | --- | --- |
| `trade_num` | int | | |
**Returns:** series float
---
### max_runup {#max_runup}
```navi
max_runup(trade_num: int): series float
```
Returns the maximum run-up (in `strategy.account_currency`) of the open trade.
**Parameters**
| Name | Type | Default | Description |
| --- | --- | --- | --- |
| `trade_num` | int | | |
**Returns:** series float
---
### max_runup_percent {#max_runup_percent}
```navi
max_runup_percent(trade_num: int): series float
```
Returns the maximum run-up (percent) of the open trade.
**Parameters**
| Name | Type | Default | Description |
| --- | --- | --- | --- |
| `trade_num` | int | | |
**Returns:** series float
---
### profit {#profit}
```navi
profit(trade_num: int): series float
```
Returns the current profit/loss (in `strategy.account_currency`) of the open trade.
**Parameters**
| Name | Type | Default | Description |
| --- | --- | --- | --- |
| `trade_num` | int | | |
**Returns:** series float
---
### profit_percent {#profit_percent}
```navi
profit_percent(trade_num: int): series float
```
Returns the current profit/loss (percent) of the open trade.
**Parameters**
| Name | Type | Default | Description |
| --- | --- | --- | --- |
| `trade_num` | int | | |
**Returns:** series float
---
### size {#size}
```navi
size(trade_num: int): series float
```
Returns the size (quantity) of the open trade.
**Parameters**
| Name | Type | Default | Description |
| --- | --- | --- | --- |
| `trade_num` | int | | |
**Returns:** series float
---
# strategy.risk
# strategy.risk
## Functions
### allow_entry_in {#allow_entry_in}
```navi
allow_entry_in(dir: simple Direction)
```
Sets which direction strategy entries are allowed in.
**Parameters**
| Name | Type | Default | Description |
| --- | --- | --- | --- |
| `dir` | simple Direction | | |
---
### max_cons_loss_days {#max_cons_loss_days}
```navi
max_cons_loss_days(count: simple int)
```
Sets the maximum number of consecutive losing days allowed.
A losing day is one where the equity at the end of the day is lower than at the start. When the number of consecutive losing days reaches the limit, all pending orders are cancelled and all positions are closed. Trading is permanently disabled for the rest of the backtest.
**Parameters**
| Name | Type | Default | Description |
| --- | --- | --- | --- |
| `count` | simple int | | The maximum number of consecutive losing days. |
---
### max_drawdown {#max_drawdown}
```navi
max_drawdown(value: simple float, type: simple DefaultQtyType)
```
Sets the maximum allowed drawdown for the strategy.
When the strategy's equity drawdown exceeds this limit, all pending orders are cancelled and all positions are closed. Trading is permanently disabled for the rest of the backtest.
**Parameters**
| Name | Type | Default | Description |
| --- | --- | --- | --- |
| `value` | simple float | | The maximum drawdown value. |
| `type` | simple DefaultQtyType | | The value type: `strategy.cash` or `strategy.percent_of_equity`. |
---
### max_intraday_filled_orders {#max_intraday_filled_orders}
```navi
max_intraday_filled_orders(count: simple int)
```
Sets the maximum number of filled orders allowed per trading day.
When the daily limit is reached, no further orders will be filled for the rest of that trading day. The counter resets at the start of each new trading day.
**Parameters**
| Name | Type | Default | Description |
| --- | --- | --- | --- |
| `count` | simple int | | The maximum number of filled orders per day. |
---
### max_intraday_loss {#max_intraday_loss}
```navi
max_intraday_loss(value: simple float, type: simple DefaultQtyType)
```
Sets the maximum allowed intraday loss for the strategy.
When the intraday loss exceeds this limit, all pending orders are cancelled and all positions are closed. Trading is disabled for the rest of the trading day and resumes on the next day.
**Parameters**
| Name | Type | Default | Description |
| --- | --- | --- | --- |
| `value` | simple float | | The maximum intraday loss value. |
| `type` | simple DefaultQtyType | | The value type: `strategy.cash` or `strategy.percent_of_equity`. |
---
### max_position_size {#max_position_size}
```navi
max_position_size(size: simple float)
```
Sets the max absolute position size.
Orders that would exceed this limit will be capped; if the minimum possible order still exceeds, no order is placed.
**Parameters**
| Name | Type | Default | Description |
| --- | --- | --- | --- |
| `size` | simple float | | |
---
# symbol_info
# symbol_info
## Properties
### base_currency {#base_currency}
**Type:** simple String
Returns base currency of the symbol.
For example, in the pair `EURUSD`, the base currency is `EUR`, in the pair `BTCUSDT`, the base currency is `BTC`.
---
### country {#country}
**Type:** simple String
Returns the two-letter code of the country where the symbol is traded, in the [ISO 3166-1 alpha-2](https://en.wikipedia.org/wiki/ISO_3166-1_alpha-2) format.
---
### currency {#currency}
**Type:** simple String
Returns the currency of the symbol's prices.
---
### current_contract {#current_contract}
**Type:** simple String
Returns the ticker identifier of the underlying contract.
---
### description {#description}
**Type:** simple String
Returns the description of the symbol.
---
### employees {#employees}
**Type:** simple int
Returns the number of employees in the company (for stocks).
---
### expiration_date {#expiration_date}
**Type:** simple int
Returns the expiration date of the symbol as UNIX timestamp in milliseconds.
---
### industry {#industry}
**Type:** simple String
Returns the industry of the company (for stocks).
---
### isin {#isin}
**Type:** simple String
Returns the International Securities Identification Number (ISIN) of the symbol.
---
### main_tickerid {#main_tickerid}
**Type:** simple String
Returns the full identifier of the chart's primary symbol.
This value keeps referring to the outer chart symbol even while code is executing inside a `request.*()` context.
---
### market {#prop-market}
**Type:** simple String
Returns the market of the symbol, e.g. `US` for `AAPL.US`.
---
### min_contract {#min_contract}
**Type:** simple float
Returns the minimum contract size for the symbol.
---
### min_move {#min_move}
**Type:** simple float
Returns the minimum price movement (tick size) for the symbol.
---
### min_tick {#min_tick}
**Type:** simple float
Returns the minimum price fluctuation (tick value) for the symbol.
---
### point_value {#point_value}
**Type:** simple float
Returns the point value for the symbol.
---
### price_scale {#price_scale}
**Type:** simple int
Returns the price scale for the symbol.
---
### recommendations_buy {#recommendations_buy}
**Type:** simple int
Returns the number of 'buy' recommendations for the symbol.
---
### recommendations_buy_strong {#recommendations_buy_strong}
**Type:** simple int
Returns the number of 'strong buy' recommendations for the symbol.
---
### recommendations_date {#recommendations_date}
**Type:** simple int
Returns the date of the latest recommendations update as UNIX timestamp in milliseconds.
---
### recommendations_hold {#recommendations_hold}
**Type:** simple int
Returns the number of 'hold' recommendations for the symbol.
---
### recommendations_sell {#recommendations_sell}
**Type:** simple int
Returns the number of 'sell' recommendations for the symbol.
---
### recommendations_sell_strong {#recommendations_sell_strong}
**Type:** simple int
Returns the number of 'strong sell' recommendations for the symbol.
---
### recommendations_total {#recommendations_total}
**Type:** simple int
Returns the total number of recommendations for the symbol.
---
### root {#root}
**Type:** simple String
Returns the root symbol of the symbol's ticker identifier.
---
### sector {#sector}
**Type:** simple String
Returns the sector of the company (for stocks).
---
### session {#session}
**Type:** simple Session
Returns the session type of the chart main series (`Session.Regular`, `Session.Extended`, or `Session.Overnight`).
---
### shareholders {#shareholders}
**Type:** simple int
Returns the number of shareholders the company has (for stocks).
---
### shares_outstanding_float {#shares_outstanding_float}
**Type:** simple float
Returns the total number of shares outstanding a company has available, excluding any of its restricted shares (for stocks).
---
### shares_outstanding_total {#shares_outstanding_total}
**Type:** simple float
Returns the total number of shares outstanding a company has available, including restricted shares held by insiders, major shareholders, and employees (for stocks).
---
### target_price_average {#target_price_average}
**Type:** simple float
Returns the latest average yearly price target for the symbol predicted by
---
### target_price_date {#target_price_date}
**Type:** simple int
Returns the date of the target price as UNIX timestamp in milliseconds (for stocks).
---
### target_price_estimates {#target_price_estimates}
**Type:** simple int
Returns the latest total number of price target predictions for the current symbol.
---
### target_price_high {#target_price_high}
**Type:** simple float
Returns the last highest yearly price target for the symbol predicted by analysts.
---
### target_price_low {#target_price_low}
**Type:** simple float
Returns the last lowest yearly price target for the symbol predicted by analysts.
---
### target_price_median {#target_price_median}
**Type:** simple float
Returns the median yearly price target for the symbol predicted by analysts.
---
### ticker {#prop-ticker}
**Type:** simple String
Returns the symbol name without its market.
---
### tickerid {#tickerid}
**Type:** simple String
Returns the full ticker identifier of the symbol.
---
### timezone {#timezone}
**Type:** simple String
Returns the timezone of the exchange of the chart main series.
---
### type {#type}
**Type:** simple String
Returns the type of the symbol.
The values are `stock`, `fund`, `dr`, `right`, `bond`, `warrant`, `structured`, `index`, `forex`, `futures`, `spread`, `economic`, `fundamental`, `crypto`, `spot`, `swap`, `option`, `commodity`.
---
### volumetype {#volumetype}
**Type:** simple String
Returns the volume type of the symbol.
The values are `base`, `quote`, `tick`.
## Functions
### market {#fn-market}
```navi
market(ticker_id: String): String
```
Returns the market of the given symbol.
**Parameters**
| Name | Type | Default | Description |
| --- | --- | --- | --- |
| `ticker_id` | String | | The symbol to get the market from. |
**Returns:** String
---
### ticker {#fn-ticker}
```navi
ticker(ticker_id: String): String
```
Returns the symbol name without its market.
**Parameters**
| Name | Type | Default | Description |
| --- | --- | --- | --- |
| `ticker_id` | String | | The symbol to get the name from. |
**Returns:** String
---
# ta.PivotType
# ta.PivotType
Pivot point calculation method for ta.pivot_point_levels.
**Kind:** enum
**Variants**
| Name | Description |
| --- | --- |
| `Traditional` | Standard HLC/3 pivot with symmetric support/resistance. |
| `Fibonacci` | Fibonacci-ratio pivot levels. |
| `Woodie` | Open-weighted pivot. |
| `Classic` | Identical to Traditional. |
| `DM` | DeMark pivot (asymmetric, depends on open vs close). |
| `Camarilla` | Camarilla narrow-range levels. |
---
# ta
# ta
## Types
| Name | Description |
| --- | --- |
| [`PivotType`](/api/stdlib/ta/PivotType) | Pivot point calculation method for ta.pivot_point_levels. |
## Properties
### accdist {#accdist}
**Type:** series float
Accumulation/Distribution Line (ADL).
It measures the cumulative flow of money into and out of a security.
---
### iii {#iii}
**Type:** series float
Intraday Intensity Index (III).
It measures the flow of volume into and out of a security.
---
### nvi {#nvi}
**Type:** series float
Negative Volume Index (NVI).
It focuses on days when the volume decreases compared to the previous day.
---
### obv {#obv}
**Type:** const float
On-Balance Volume (OBV).
It measures buying and selling pressure as a cumulative indicator that adds volume on up days and subtracts volume on down days.
---
### pvi {#pvi}
**Type:** const float
Positive Volume Index (PVI).
It focuses on days when the volume increases compared to the previous day.
---
### pvt {#pvt}
**Type:** const float
Price Volume Trend (PVT).
It combines price and volume to determine the strength of price movements.
---
### tr {#prop-tr}
**Type:** series float
True Range (TR) with na handling enabled.
Equivalent to `ta.tr(handle_na = true)`.
---
### vwap {#prop-vwap}
**Type:** series float
Daily Volume Weighted Average Price using hlc3 as source.
Resets at the start of each day. This is the standard VWAP used on most trading platforms.
---
### wad {#wad}
**Type:** const float
Williams Accumulation/Distribution (WAD).
It measures buying and selling pressure by comparing the close price to the high-low range.
---
### wvad {#wvad}
**Type:** const float
Williams Variable Accumulation/Distribution (WVAAD).
It adjusts the accumulation/distribution calculation by considering the position of the close price within the true range.
## Functions
### alma {#alma}
```navi
alma(
series: series float,
length: series int,
offset: simple float,
sigma: simple float,
floor: simple bool = false
): series float
```
Arnaud Legoux Moving Average.
It uses Gaussian distribution as weights for moving average.
**Parameters**
| Name | Type | Default | Description |
| --- | --- | --- | --- |
| `series` | series float | | Series of values to process. |
| `length` | series int | | Number of bars (length). |
| `offset` | simple float | | Controls tradeoff between smoothness (closer to 1) and responsiveness (closer to 0). |
| `sigma` | simple float | | Changes the smoothness of ALMA. The larger sigma the smoother ALMA. |
| `floor` | simple bool | `false` | Specifies whether the offset calculation is floored before ALMA is calculated. |
**Returns:** series float
**See Also:** ta.sma, ta.ema
---
### atr {#atr}
```navi
atr(length: simple int): series float
```
Calculates the Average True Range (ATR) of a financial instrument over a specified `length`.
**Parameters**
| Name | Type | Default | Description |
| --- | --- | --- | --- |
| `length` | simple int | | The number of bars for the ATR calculation. |
**Returns:** series float
**See Also:** ta.rma, ta.supertrend
---
### bars_since {#bars_since}
```navi
bars_since(condition: series bool): series int
```
Counts the number of bars since the last time the condition was true.
If the condition has never been true, it returns na.
**Parameters**
| Name | Type | Default | Description |
| --- | --- | --- | --- |
| `condition` | series bool | | The boolean condition to check. |
**Returns:** series int — The number of bars since the condition was last true, or `na` if it has never been true.
**See Also:** ta.highest_bars, ta.lowest_bars
---
### bb {#bb}
```navi
bb(series: series float, length: series int, mult: simple float)
```
Bollinger Bands (BB).
**Parameters**
| Name | Type | Default | Description |
| --- | --- | --- | --- |
| `series` | series float | | The input series for BB calculation. |
| `length` | series int | | The number of bars for the calculation. |
| `mult` | simple float | | The multiplier for the standard deviation bands. |
**Returns:** A tuple of `[basis, upper, lower]` where basis is the SMA, upper/lower are basis ± mult × stdev.
**Examples**
```navi
let (bbBasis, bbUpper, bbLower) = ta.bb(close, 20, 2.0);
plot(bbBasis, title: "BB Basis", color: Color.ORANGE);
plot(bbUpper, title: "BB Upper", color: Color.BLUE);
plot(bbLower, title: "BB Lower", color: Color.BLUE);
```
**See Also:** ta.bbw, ta.sma, ta.stdev
---
### bbw {#bbw}
```navi
bbw(source: series float, length: series int, mult: simple float): series float
```
Bollinger Band Width (BBW).
It measures the width of the Bollinger Bands relative to the moving average.
**Parameters**
| Name | Type | Default | Description |
| --- | --- | --- | --- |
| `source` | series float | | The input series for BBW calculation. |
| `length` | series int | | The number of bars for the calculation. |
| `mult` | simple float | | The multiplier for the standard deviation bands. |
**Returns:** series float — The bandwidth as a percentage: `(upper - lower) / basis × 100`.
**See Also:** ta.bb, ta.stdev
---
### cci {#cci}
```navi
cci(source: series float, length: series int): series float
```
Commodity Channel Index (CCI).
It measures the deviation of the `series` series from its statistical mean.
**Parameters**
| Name | Type | Default | Description |
| --- | --- | --- | --- |
| `source` | series float | | The input series for the calculation. |
| `length` | series int | | The number of bars for the calculation. |
**Returns:** series float
**See Also:** ta.sma, ta.dev
---
### change {#change}
Calculates the difference between the current `source` value and its value `length` bars ago.
Useful for measuring momentum or rate of change.
**Parameters**
| Name | Type | Default | Description |
| --- | --- | --- | --- |
| `source` | series int | | The integer series to compare. |
| `length` | series int | `1` | Number of bars to look back. Defaults to 1 (previous bar). |
**Returns:** series int — `source - source[length]`.
Calculates the difference between the current `source` value and its value `length` bars ago.
**Parameters**
| Name | Type | Default | Description |
| --- | --- | --- | --- |
| `source` | series float | | The float series to compare. |
| `length` | series int | `1` | Number of bars to look back. Defaults to 1 (previous bar). |
**Returns:** series float — `source - source[length]`.
Detects if a boolean value has changed from its value `length` bars ago.
Useful for detecting state transitions (e.g., signal flips).
**Parameters**
| Name | Type | Default | Description |
| --- | --- | --- | --- |
| `source` | series bool | | The boolean series to compare. |
| `length` | series int | `1` | Number of bars to look back. Defaults to 1 (previous bar). |
**Returns:** series bool — `true` if the current value differs from the historical value, `false` otherwise.
---
### chop {#chop}
```navi
chop(length: simple int): series float
```
Choppiness Index (CHOP).
Quantifies how directional (trending) or sideways (choppy) the market is. Values near 100 signal maximum choppiness; values near the lower bound (≈ `100/log10(length)`) signal strong trend. Formula: `100 * log10(sum(ATR(1), length) / (highest_high - lowest_low)) / log10(length)`.
**Parameters**
| Name | Type | Default | Description |
| --- | --- | --- | --- |
| `length` | simple int | | The lookback period (must be >= 2). |
**Returns:** series float
---
### cmf {#cmf}
```navi
cmf(length: simple int): series float
```
Chaikin Money Flow (CMF).
Measures buying and selling pressure over `length` bars using the Money Flow Multiplier weighted by volume. Positive values indicate accumulation; negative values indicate distribution. Formula: `sum(MFV, length) / sum(volume, length)` where `MFV = ((close - low) - (high - close)) / (high - low) * volume`.
**Parameters**
| Name | Type | Default | Description |
| --- | --- | --- | --- |
| `length` | simple int | | The number of bars to accumulate. |
**Returns:** series float
---
### cmo {#cmo}
```navi
cmo(series: series float, length: series int): series float
```
Chande Momentum Oscillator (CMO).
It measures the momentum of the `series` series over the specified `length`.
**Parameters**
| Name | Type | Default | Description |
| --- | --- | --- | --- |
| `series` | series float | | The input series for the calculation. |
| `length` | series int | | The number of bars for the calculation. |
**Returns:** series float — A value between -100 and 100. Positive values indicate upward momentum, negative indicate downward.
**See Also:** ta.change
---
### cog {#cog}
```navi
cog(source: series float, length: series int): series float
```
Center of Gravity (COG).
It identifies the center of gravity of the `source` series over the specified `length`.
**Parameters**
| Name | Type | Default | Description |
| --- | --- | --- | --- |
| `source` | series float | | The input series for the calculation. |
| `length` | series int | | The number of bars for the calculation. |
**Returns:** series float
---
### correlation {#correlation}
```navi
correlation(
source1: series float,
source2: series float,
length: series int
): series float
```
Pearson Correlation Coefficient between two series over the specified `length`.
**Parameters**
| Name | Type | Default | Description |
| --- | --- | --- | --- |
| `source1` | series float | | The first input series. |
| `source2` | series float | | The second input series. |
| `length` | series int | | The number of bars for the calculation. |
**Returns:** series float — A value between -1.0 (perfectly negatively correlated) and 1.0 (perfectly positively correlated). 0.0 indicates no linear correlation.
---
### cross {#cross}
```navi
cross(source1: series float, source2: series float): series bool
```
Detects if `source1` has crossed `source2` in either direction.
**Parameters**
| Name | Type | Default | Description |
| --- | --- | --- | --- |
| `source1` | series float | | The first series to compare. |
| `source2` | series float | | The second series to compare. |
**Returns:** series bool
**See Also:** ta.cross_over, ta.cross_under
---
### cross_over {#cross_over}
```navi
cross_over(source1: series float, source2: series float): series bool
```
Detects if `source1` has crossed over `source2`.
**Parameters**
| Name | Type | Default | Description |
| --- | --- | --- | --- |
| `source1` | series float | | The first series to compare. |
| `source2` | series float | | The second series to compare. |
**Returns:** series bool
**Examples**
```navi
let fastEma = ta.ema(close, 9);
let slowEma = ta.ema(close, 21);
if ta.cross_over(fastEma, slowEma) {
label.new(bar_index, low, "Buy", style: LabelStyle.Up);
}
```
**See Also:** ta.cross_under, ta.cross
---
### cross_under {#cross_under}
```navi
cross_under(source1: series float, source2: series float): series bool
```
Detects if `source1` has crossed under `source2`.
**Parameters**
| Name | Type | Default | Description |
| --- | --- | --- | --- |
| `source1` | series float | | The first series to compare. |
| `source2` | series float | | The second series to compare. |
**Returns:** series bool
**Examples**
```navi
let fastEma = ta.ema(close, 9);
let slowEma = ta.ema(close, 21);
if ta.cross_under(fastEma, slowEma) {
label.new(bar_index, high, "Sell", style: LabelStyle.Down);
}
```
**See Also:** ta.cross_over, ta.cross
---
### cum {#cum}
```navi
cum(source: series float): series float
```
Cumulative sum of the `source` series.
In other words it's a sum of all elements of the `source` series.
**Parameters**
| Name | Type | Default | Description |
| --- | --- | --- | --- |
| `source` | series float | | The input series to accumulate. |
**Returns:** series float
---
### dema {#dema}
```navi
dema(source: series float, length: simple int): series float
```
Double Exponential Moving Average (DEMA).
Reduces the lag of a standard EMA by subtracting an EMA of the EMA. Formula: `2 * EMA(source, length) - EMA(EMA(source, length), length)`.
**Parameters**
| Name | Type | Default | Description |
| --- | --- | --- | --- |
| `source` | series float | | The series to smooth. |
| `length` | simple int | | The smoothing period. |
**Returns:** series float
**See Also:** ta.ema, ta.tema
---
### dev {#dev}
```navi
dev(source: series float, length: series int): series float
```
Mean Deviation of the `source` series over the specified `length`.
**Parameters**
| Name | Type | Default | Description |
| --- | --- | --- | --- |
| `source` | series float | | The input series for the calculation. |
| `length` | series int | | The number of bars for the calculation. |
**Returns:** series float
---
### dmi {#dmi}
```navi
dmi(di_length: simple int, adx_smoothing: simple int)
```
Directional Movement Index (DMI).
**Parameters**
| Name | Type | Default | Description |
| --- | --- | --- | --- |
| `di_length` | simple int | | The length for Directional Indicator calculation. |
| `adx_smoothing` | simple int | | The smoothing length for ADX calculation. |
**Returns:** A tuple of `[plus_di, minus_di, adx]`, all expressed as percentages (0–100).
**See Also:** ta.atr, ta.rma
---
### ema {#ema}
```navi
ema(source: series float, length: simple int): series float
```
Exponential Moving Average (EMA).
It gives more weight to recent prices to make it more responsive to new information.
**Parameters**
| Name | Type | Default | Description |
| --- | --- | --- | --- |
| `source` | series float | | The input series for the calculation. |
| `length` | simple int | | The number of bars for the calculation. |
**Returns:** series float
**Examples**
```navi
let ema12 = ta.ema(close, 12);
let ema26 = ta.ema(close, 26);
plot(ema12, title: "EMA 12", color: Color.GREEN);
plot(ema26, title: "EMA 26", color: Color.RED);
```
**See Also:** ta.sma, ta.wma, ta.rma, ta.dema, ta.tema
---
### falling {#falling}
```navi
falling(source: series float, length: series int): series bool
```
Checks if the `source` series is falling over the specified `length`.
**Parameters**
| Name | Type | Default | Description |
| --- | --- | --- | --- |
| `source` | series float | | The input series to check. |
| `length` | series int | | The number of bars to check. |
**Returns:** series bool
**See Also:** ta.rising
---
### highest {#highest}
Returns the highest value of the `high` series over the specified `length`.
**Parameters**
| Name | Type | Default | Description |
| --- | --- | --- | --- |
| `length` | series int | | The number of bars to check. |
**Returns:** series float
Returns the highest value of the `source` series over the specified `length`.
**Parameters**
| Name | Type | Default | Description |
| --- | --- | --- | --- |
| `source` | series float | | The input series to evaluate. |
| `length` | series int | | The number of bars to check. |
**Returns:** series float
**Examples**
```navi
let highestHigh = ta.highest(high, 20);
plot(highestHigh, title: "20-bar High", color: Color.RED,
style: PlotStyle.Stepline);
```
---
### highest_bars {#highest_bars}
Returns the number of bars since the highest value of the `source` series over the specified `length`.
**Parameters**
| Name | Type | Default | Description |
| --- | --- | --- | --- |
| `source` | series float | | The input series to evaluate. |
| `length` | series int | | The number of bars to check. |
**Returns:** series int — A non-positive offset (0 if the highest is the current bar, negative otherwise), or `na` if any value in the window is `na`.
Returns the number of bars since the highest value of the `high` series over the specified `length`.
**Parameters**
| Name | Type | Default | Description |
| --- | --- | --- | --- |
| `length` | series int | | The number of bars to check. |
**Returns:** series int
---
### hma {#hma}
```navi
hma(source: series float, length: simple int): series float
```
Hull Moving Average (HMA).
It aims to reduce lag while maintaining a smooth curve.
**Parameters**
| Name | Type | Default | Description |
| --- | --- | --- | --- |
| `source` | series float | | The input series for the calculation. |
| `length` | simple int | | The number of bars for the calculation. |
**Returns:** series float
**See Also:** ta.sma, ta.ema, ta.wma
---
### kc {#kc}
```navi
kc(
series: series float,
length: simple int,
mult: simple float,
use_true_range: simple bool = true
)
```
Keltner Channels (KC).
**Parameters**
| Name | Type | Default | Description |
| --- | --- | --- | --- |
| `series` | series float | | The input series for KC calculation. |
| `length` | simple int | | The number of bars for the calculation. |
| `mult` | simple float | | The multiplier for the channel bands. |
| `use_true_range` | simple bool | `true` | Whether to use True Range. |
**Returns:** A tuple of `[basis, upper, lower]` where basis is the EMA, upper/lower are basis ± mult × range EMA.
**See Also:** ta.kcw, ta.ema, ta.atr
---
### kcw {#kcw}
```navi
kcw(
series: series float,
length: simple int,
mult: simple float,
use_true_range: simple bool = true
): series float
```
Keltner Channel Width (KCW).
It measures the width of the Keltner Channels relative to the moving average.
**Parameters**
| Name | Type | Default | Description |
| --- | --- | --- | --- |
| `series` | series float | | The input series for KCW calculation. |
| `length` | simple int | | The number of bars for the calculation. |
| `mult` | simple float | | The multiplier for the channel bands. |
| `use_true_range` | simple bool | `true` | Whether to use True Range. |
**Returns:** series float — The channel width as a ratio: `(upper - lower) / basis`.
**See Also:** ta.kc
---
### linreg {#linreg}
```navi
linreg(
source: series float,
length: series int,
offset: simple int
): series float
```
Linear Regression (LINREG).
It fits a linear regression line to the `source` series over the specified `length` and returns the value at the given `offset`.
**Parameters**
| Name | Type | Default | Description |
| --- | --- | --- | --- |
| `source` | series float | | The input series for the calculation. |
| `length` | series int | | The number of bars for the regression. |
| `offset` | simple int | | The offset for the regression line (future bar offset). |
**Returns:** series float
---
### lowest {#lowest}
Returns the lowest value of the `low` series over the specified `length`.
**Parameters**
| Name | Type | Default | Description |
| --- | --- | --- | --- |
| `length` | series int | | The number of bars to check. |
**Returns:** series float
Returns the lowest value of the `source` series over the specified `length`.
**Parameters**
| Name | Type | Default | Description |
| --- | --- | --- | --- |
| `source` | series float | | The input series to evaluate. |
| `length` | series int | | The number of bars to check. |
**Returns:** series float
---
### lowest_bars {#lowest_bars}
Returns the number of bars since the lowest value of the `source` series over the specified `length`.
**Parameters**
| Name | Type | Default | Description |
| --- | --- | --- | --- |
| `source` | series float | | The input series to evaluate. |
| `length` | series int | | The number of bars to check. |
**Returns:** series int — A non-positive offset (0 if the lowest is the current bar, negative otherwise), or `na` if any value in the window is `na`.
Returns the number of bars since the lowest value of the `low` series over the specified `length`.
**Parameters**
| Name | Type | Default | Description |
| --- | --- | --- | --- |
| `length` | series int | | The number of bars to check. |
**Returns:** series int
---
### macd {#macd}
```navi
macd(
source: series float,
fast_length: simple int,
slow_length: simple int,
signal_length: simple int
)
```
Moving Average Convergence Divergence (MACD).
**Parameters**
| Name | Type | Default | Description |
| --- | --- | --- | --- |
| `source` | series float | | The input series for the calculation. |
| `fast_length` | simple int | | The length for the fast EMA. |
| `slow_length` | simple int | | The length for the slow EMA. |
| `signal_length` | simple int | | The length for the signal line EMA. |
**Returns:** A tuple of `[macd_line, signal_line, histogram]` where histogram = macd_line − signal_line.
**Examples**
```navi
let (macdLine, signalLine, histLine) = ta.macd(close, 12, 26, 9);
plot(macdLine, title: "MACD", color: Color.BLUE);
plot(signalLine, title: "Signal", color: Color.ORANGE);
plot(histLine, title: "Hist", color: Color.GRAY, style: PlotStyle.Histogram);
```
**See Also:** ta.ema
---
### max {#max}
```navi
max(source: series float): series float
```
Returns the maximum value of the `source` series.
**Parameters**
| Name | Type | Default | Description |
| --- | --- | --- | --- |
| `source` | series float | | The input series to evaluate. |
**Returns:** series float
---
### median {#median}
```navi
median(source: series float, length: series int): series float
```
Returns the median value of the `source` series over the specified `length`.
**Parameters**
| Name | Type | Default | Description |
| --- | --- | --- | --- |
| `source` | series float | | The input series to evaluate. |
| `length` | series int | | The number of bars for the calculation. |
**Returns:** series float
**See Also:** ta.mode
---
### mfi {#mfi}
```navi
mfi(series: series float, length: series int): series float
```
Money Flow Index (MFI).
It measures the inflow and outflow of money into an asset over the specified `length`.
**Parameters**
| Name | Type | Default | Description |
| --- | --- | --- | --- |
| `series` | series float | | The input series for the calculation. |
| `length` | series int | | The number of bars for the calculation. |
**Returns:** series float — A value between 0 and 100. Values above 80 indicate overbought conditions, below 20 indicate oversold.
---
### min {#min}
```navi
min(source: series float): series float
```
Returns the minimum value of the `source` series.
**Parameters**
| Name | Type | Default | Description |
| --- | --- | --- | --- |
| `source` | series float | | The input series to evaluate. |
**Returns:** series float
---
### mode {#mode}
```navi
mode(source: series float, length: series int): series float
```
Returns the mode (most frequently occurring value) of the `series` series over the specified `length`.
**Parameters**
| Name | Type | Default | Description |
| --- | --- | --- | --- |
| `source` | series float | | The input series to evaluate. |
| `length` | series int | | The number of bars for the calculation. |
**Returns:** series float
**See Also:** ta.median
---
### mom {#mom}
```navi
mom(source: series float, length: series int): series float
```
Calculates the momentum of the `source` series over the specified `length`.
**Parameters**
| Name | Type | Default | Description |
| --- | --- | --- | --- |
| `source` | series float | | The input series for the calculation. |
| `length` | series int | | The number of bars for the calculation. |
**Returns:** series float
**See Also:** ta.change, ta.roc
---
### percent_rank {#percent_rank}
```navi
percent_rank(source: series float, length: series int): series float
```
Returns the percentile rank of the current value in the `source` series over the specified `length`.
**Parameters**
| Name | Type | Default | Description |
| --- | --- | --- | --- |
| `source` | series float | | The input series to evaluate. |
| `length` | series int | | The number of bars for the calculation. |
**Returns:** series float — A value between 0 and 100 indicating the percentage of values that are less than or equal to the current value.
---
### percentile_linear_interpolation {#percentile_linear_interpolation}
```navi
percentile_linear_interpolation(
source: series float,
length: series int,
percentage: simple float
): series float
```
Returns the percentile value of the `source` series over the specified `length` using linear interpolation.
**Parameters**
| Name | Type | Default | Description |
| --- | --- | --- | --- |
| `source` | series float | | The input series to evaluate. |
| `length` | series int | | The number of bars for the calculation. |
| `percentage` | simple float | | The percentile value (0-100). |
**Returns:** series float
**See Also:** ta.percentile_nearest_rank
---
### percentile_nearest_rank {#percentile_nearest_rank}
```navi
percentile_nearest_rank(
source: series float,
length: series int,
percentage: simple float
): series float
```
Returns the percentile value of the `source` series over the specified `length` using the nearest-rank method.
**Parameters**
| Name | Type | Default | Description |
| --- | --- | --- | --- |
| `source` | series float | | The input series to evaluate. |
| `length` | series int | | The number of bars for the calculation. |
| `percentage` | simple float | | The percentile value (0-100). |
**Returns:** series float
**See Also:** ta.percentile_linear_interpolation
---
### pivot_high {#pivot_high}
Returns the price of the pivot high point.
It returns 'NaN', if there was no pivot high point.
**Parameters**
| Name | Type | Default | Description |
| --- | --- | --- | --- |
| `source` | series float | | The input series to analyze. |
| `left_bars` | series int | | The number of bars to the left to check. |
| `right_bars` | series int | | The number of bars to the right to check. |
**Returns:** series float — The pivot high price (offset by `right_bars`), or `na` if no pivot is found at that point.
Returns the price of the pivot high point.
It returns 'NaN', if there was no pivot high point.
**Parameters**
| Name | Type | Default | Description |
| --- | --- | --- | --- |
| `left_bars` | series int | | The number of bars to the left to check. |
| `right_bars` | series int | | The number of bars to the right to check. |
**Returns:** series float — The pivot high price (offset by `right_bars`), or `na` if no pivot is found at that point.
---
### pivot_low {#pivot_low}
Returns the price of the pivot low point.
It returns 'NaN', if there was no pivot low point.
**Parameters**
| Name | Type | Default | Description |
| --- | --- | --- | --- |
| `source` | series float | | The input series to analyze. |
| `left_bars` | series int | | The number of bars to the left to check. |
| `right_bars` | series int | | The number of bars to the right to check. |
**Returns:** series float — The pivot low price (offset by `right_bars`), or `na` if no pivot is found at that point.
Returns the price of the pivot low point.
It returns 'NaN', if there was no pivot low point.
**Parameters**
| Name | Type | Default | Description |
| --- | --- | --- | --- |
| `left_bars` | series int | | The number of bars to the left to check. |
| `right_bars` | series int | | The number of bars to the right to check. |
**Returns:** series float — The pivot low price (offset by `right_bars`), or `na` if no pivot is found at that point.
---
### pivot_point_levels {#pivot_point_levels}
```navi
pivot_point_levels(
type: series PivotType,
change: series bool
): series Array
```
Returns an array of pivot point levels for the specified pivot type.
The returned array contains up to 11 values in the order: [P, S1, R1, S2, R2, S3, R3, S4, R4, S5, R5]. Levels that do not apply for the chosen type are `na`.
**Parameters**
| Name | Type | Default | Description |
| --- | --- | --- | --- |
| `type` | series PivotType | | The pivot calculation method. |
| `change` | series bool | | `true` on the first bar of a new pivot period. |
**Returns:** series Array<float>
---
### range {#range}
```navi
range(source: series float, length: series int): series float
```
Returns the range (difference between highest and lowest) of the `source` series over the specified `length`.
**Parameters**
| Name | Type | Default | Description |
| --- | --- | --- | --- |
| `source` | series float | | The input series to evaluate. |
| `length` | series int | | The number of bars for the calculation. |
**Returns:** series float
---
### rci {#rci}
```navi
rci(source: series float, length: simple int): series float
```
Rank Correlation Index (RCI).
It measures the strength and direction of a linear relationship between the ranks of two variables over the specified `length`.
**Parameters**
| Name | Type | Default | Description |
| --- | --- | --- | --- |
| `source` | series float | | The input series for the calculation. |
| `length` | simple int | | The number of bars for the calculation. |
**Returns:** series float — A value between -100 and 100. +100 means prices are perfectly rising, -100 means perfectly falling.
---
### rising {#rising}
```navi
rising(source: series float, length: series int): series bool
```
Checks if the `source` series is rising over the specified `length`.
**Parameters**
| Name | Type | Default | Description |
| --- | --- | --- | --- |
| `source` | series float | | The input series to check. |
| `length` | series int | | The number of bars to check. |
**Returns:** series bool
**See Also:** ta.falling
---
### rma {#rma}
```navi
rma(source: series float, length: series int): series float
```
Recursive Moving Average (RMA).
It is similar to an Exponential Moving Average (EMA) but uses a different smoothing factor.
**Parameters**
| Name | Type | Default | Description |
| --- | --- | --- | --- |
| `source` | series float | | The input series for the calculation. |
| `length` | series int | | The length for the RMA calculation. |
**Returns:** series float
**See Also:** ta.ema
---
### roc {#roc}
```navi
roc(source: series float, length: series int): series float
```
Rate of Change (ROC).
It measures the percentage change between the current value and the value `length` bars ago.
**Parameters**
| Name | Type | Default | Description |
| --- | --- | --- | --- |
| `source` | series float | | The input series for the calculation. |
| `length` | series int | | The number of bars for the comparison. |
**Returns:** series float — The percentage change: `100 × (source − source[length]) / source[length]`.
**See Also:** ta.change, ta.mom
---
### rsi {#rsi}
```navi
rsi(source: series float, length: series int): series float
```
Relative Strength Index (RSI).
It measures the speed and change of price movements over the specified `length`.
**Parameters**
| Name | Type | Default | Description |
| --- | --- | --- | --- |
| `source` | series float | | The input series for the calculation. |
| `length` | series int | | The number of bars for the calculation. |
**Returns:** series float — A value between 0 and 100. Values above 70 typically indicate overbought, below 30 oversold.
**Examples**
```navi
let rsiValue = ta.rsi(close, 14);
plot(rsiValue, title: "RSI", color: Color.PURPLE);
hline(70, "Overbought", color: Color.RED);
hline(30, "Oversold", color: Color.GREEN);
```
**See Also:** ta.rma, ta.stoch
---
### sar {#sar}
```navi
sar(start: simple float, inc: simple float, max: simple float): series float
```
Parabolic SAR.
**Parameters**
| Name | Type | Default | Description |
| --- | --- | --- | --- |
| `start` | simple float | | The starting acceleration factor. |
| `inc` | simple float | | The increment for the acceleration factor. |
| `max` | simple float | | The maximum acceleration factor. |
**Returns:** series float — The SAR value for the current bar.
---
### sma {#sma}
```navi
sma(source: series float, length: series int): series float
```
Simple Moving Average (SMA).
Calculates the average of the `source` series over the specified `length`.
**Parameters**
| Name | Type | Default | Description |
| --- | --- | --- | --- |
| `source` | series float | | The input series for the calculation. |
| `length` | series int | | The number of bars for the calculation. |
**Returns:** series float
**Examples**
```navi
let sma20 = ta.sma(close, 20);
plot(sma20, title: "SMA 20", color: Color.BLUE);
```
**See Also:** ta.ema, ta.wma, ta.rma, ta.hma
---
### stdev {#stdev}
```navi
stdev(
source: series float,
length: series int,
biased: series bool = true
): series float
```
Calculates the standard deviation of the `source` series over the specified `length`.
**Parameters**
| Name | Type | Default | Description |
| --- | --- | --- | --- |
| `source` | series float | | The input series for the calculation. |
| `length` | series int | | The number of bars for the calculation. |
| `biased` | series bool | `true` | If true, function will calculate using a biased estimate of the entire population, if false - unbiased estimate of a sample. |
**Returns:** series float
**See Also:** ta.variance, ta.bb
---
### stoch {#stoch}
```navi
stoch(
source: series float,
high: series float,
low: series float,
length: series int
): series float
```
Stochastic Oscillator (STOCH).
It compares the `source` series to its price range over the specified `length`.
**Parameters**
| Name | Type | Default | Description |
| --- | --- | --- | --- |
| `source` | series float | | The input series for the calculation. |
| `high` | series float | | The high series for the range. |
| `low` | series float | | The low series for the range. |
| `length` | series int | | The number of bars for the calculation. |
**Returns:** series float — A value between 0 and 100 representing the position of the source within the high-low range.
**See Also:** ta.rsi, ta.wpr
---
### supertrend {#supertrend}
```navi
supertrend(factor: series float, atr_period: simple int)
```
SuperTrend indicator.
**Parameters**
| Name | Type | Default | Description |
| --- | --- | --- | --- |
| `factor` | series float | | The multiplier for ATR in the SuperTrend calculation. |
| `atr_period` | simple int | | The period for ATR calculation. |
**Returns:** A tuple of `[super_trend, direction]` where direction is -1 (uptrend/bullish) or 1 (downtrend/bearish).
**See Also:** ta.atr
---
### swma {#swma}
```navi
swma(source: series float): series float
```
Smoothed Weighted Moving Average (SWMA).
It applies weighted moving average smoothing to the `source` series.
**Parameters**
| Name | Type | Default | Description |
| --- | --- | --- | --- |
| `source` | series float | | The input series for the calculation. |
**Returns:** series float
---
### tema {#tema}
```navi
tema(source: series float, length: simple int): series float
```
Triple Exponential Moving Average (TEMA).
Further reduces EMA lag using three layers of smoothing. Formula: `3*EMA1 - 3*EMA2 + EMA3` where each EMA is applied to the previous layer's output.
**Parameters**
| Name | Type | Default | Description |
| --- | --- | --- | --- |
| `source` | series float | | The series to smooth. |
| `length` | simple int | | The smoothing period. |
**Returns:** series float
**See Also:** ta.ema, ta.dema
---
### tr {#fn-tr}
```navi
tr(handle_na: simple bool): series float
```
True Range (TR).
Measures volatility by accounting for gaps between bars. TR is the greatest of: (high - low), |high - previous close|, |low - previous close|. This captures overnight gaps and limit moves that high-low alone would miss.
**Parameters**
| Name | Type | Default | Description |
| --- | --- | --- | --- |
| `handle_na` | simple bool | | If true and previous close is `na` (first bar), uses `high - low` as TR. If false, returns `na` in that case. |
**Returns:** series float
---
### tsi {#tsi}
```navi
tsi(
source: series float,
short_length: simple int,
long_length: simple int
): series float
```
True Strength Index (TSI).
**Parameters**
| Name | Type | Default | Description |
| --- | --- | --- | --- |
| `source` | series float | | The input series for the calculation. |
| `short_length` | simple int | | The short EMA length for TSI calculation. |
| `long_length` | simple int | | The long EMA length for TSI calculation. |
**Returns:** series float — A value between -1.0 and 1.0 representing momentum strength and direction.
---
### value_when {#value_when}
```navi
value_when(
condition: series bool,
source: series T,
occurrence: simple int
): series T
```
Returns the value of the `source` series at the time when the `condition` was true for the specified `occurrence`.
The `occurrence` parameter selects which match to return: 0 for the most recent, 1 for the one before that, etc.
**Parameters**
| Name | Type | Default | Description |
| --- | --- | --- | --- |
| `condition` | series bool | | The condition to evaluate. |
| `source` | series T | | The series to retrieve the value from. |
| `occurrence` | simple int | | Which occurrence to retrieve (0 for the most recent). |
**Returns:** series T — The `source` value at the specified occurrence, or `na` if fewer matches have occurred.
---
### variance {#variance}
```navi
variance(
source: series float,
length: series int,
biased: series bool = true
): series float
```
Variance of the `source` series over the specified `length`.
**Parameters**
| Name | Type | Default | Description |
| --- | --- | --- | --- |
| `source` | series float | | The input series for the calculation. |
| `length` | series int | | The number of bars for the calculation. |
| `biased` | series bool | `true` | If true, uses biased estimation; if false, uses unbiased estimation. |
**Returns:** series float
**See Also:** ta.stdev
---
### vhf {#vhf}
```navi
vhf(source: series float, length: simple int): series float
```
Vertical Horizontal Filter (VHF).
Identifies whether the market is trending or ranging by comparing the price range to the sum of absolute bar-to-bar changes. Higher values indicate a stronger trend; lower values indicate choppiness. Formula: `(highest - lowest) / sum(|change|, length)`.
**Parameters**
| Name | Type | Default | Description |
| --- | --- | --- | --- |
| `source` | series float | | The price series to analyze. |
| `length` | simple int | | The lookback period. |
**Returns:** series float
---
### vwap {#fn-vwap}
Volume Weighted Average Price with optional standard deviation bands.
VWAP accumulates since the anchor resets (typically daily) and weights price by volume, giving a benchmark that institutions often use. Returns a tuple of [vwap, upper_band, lower_band] where bands are vwap +/- stdev_mult * stddev.
**Parameters**
| Name | Type | Default | Description |
| --- | --- | --- | --- |
| `source` | series float | | The price series (commonly hlc3). |
| `anchor` | series bool | | When true, resets the VWAP calculation. Typically `timeframe.change("1D")`. |
| `stdev_mult` | series float | | Multiplier for standard deviation bands. Use `na` to disable bands. |
**Returns:** A tuple of `[vwap, upper_band, lower_band]`. Bands are `na` when `stdev_mult` is `na`.
Volume Weighted Average Price without bands.
**Parameters**
| Name | Type | Default | Description |
| --- | --- | --- | --- |
| `source` | series float | | The price series (commonly hlc3). |
| `anchor` | series bool | `timeframe.change("1D")` | When true, resets the VWAP. Defaults to daily reset (`timeframe.change("1D")`). |
**Returns:** series float — A single VWAP series that resets when `anchor` is true.
---
### vwma {#vwma}
```navi
vwma(source: series float, length: series int): series float
```
Volume Weighted Moving Average (VWMA).
It gives more weight to periods with higher volume.
**Parameters**
| Name | Type | Default | Description |
| --- | --- | --- | --- |
| `source` | series float | | The input series for the calculation. |
| `length` | series int | | The number of bars for the calculation. |
**Returns:** series float
---
### wma {#wma}
```navi
wma(source: series float, length: series int): series float
```
Weighted Moving Average (WMA).
It assigns more weight to recent data points.
**Parameters**
| Name | Type | Default | Description |
| --- | --- | --- | --- |
| `source` | series float | | The input series for the calculation. |
| `length` | series int | | The number of bars for the calculation. |
**Returns:** series float
**See Also:** ta.sma, ta.ema, ta.hma
---
### wpr {#wpr}
```navi
wpr(length: series int): series float
```
Williams Percent Range (WPR).
It measures overbought and oversold levels by comparing the `close` price to the high-low range over the specified `length`.
**Parameters**
| Name | Type | Default | Description |
| --- | --- | --- | --- |
| `length` | series int | | The number of bars for the calculation. |
**Returns:** series float — A value between -100 and 0. Values above -20 indicate overbought, below -80 indicate oversold.
**See Also:** ta.stoch
---
# ticker
# ticker
## Functions
### heikin_ashi {#heikin_ashi}
```navi
heikin_ashi(ticker_id: series String): series String
```
Creates a ticker identifier for requesting Heikin Ashi bar values.
**Parameters**
| Name | Type | Default | Description |
| --- | --- | --- | --- |
| `ticker_id` | series String | | The base ticker id to modify (e.g. `syminfo.tickerid`). |
**Returns:** series String — A ticker id string usable with `request.security`.
---
### inherit {#inherit}
```navi
inherit(from_ticker_id: series String, ticker_id: series String): series String
```
Constructs a ticker id for a symbol carrying all modifiers of another ticker id.
**Parameters**
| Name | Type | Default | Description |
| --- | --- | --- | --- |
| `from_ticker_id` | series String | | The ticker id whose modifiers are inherited. |
| `ticker_id` | series String | | The base ticker id supplying the symbol. |
**Returns:** series String — A ticker id string usable with `request.security`.
---
### kagi {#kagi}
```navi
kagi(
ticker_id: series String,
param: series float,
style: series BoxStyle = BoxStyle.Traditional
): series String
```
Creates a ticker identifier for requesting Kagi values.
**Parameters**
| Name | Type | Default | Description |
| --- | --- | --- | --- |
| `ticker_id` | series String | | The base ticker id (e.g. `symbol_info.tickerid`). |
| `param` | series float | | Reversal amount (Traditional) or ATR length (ATR). |
| `style` | series BoxStyle | `BoxStyle.Traditional` | Box size assignment method. |
**Returns:** series String — A ticker id string usable with `request.security`.
---
### line_break {#line_break}
```navi
line_break(ticker_id: series String, num_lines: series int = 3): series String
```
Creates a ticker identifier for requesting Line Break values.
**Parameters**
| Name | Type | Default | Description |
| --- | --- | --- | --- |
| `ticker_id` | series String | | The base ticker id to modify (e.g. `symbol_info.tickerid`). |
| `num_lines` | series int | `3` | Number of lines used for break calculation. |
**Returns:** series String — A ticker id string usable with `request.security`.
---
### modify {#modify}
```navi
modify(
ticker_id: series String,
session: series Session = na,
adjustment: series Adjustment = na,
backadjustment: simple BackAdjustment = na,
settlement_as_close: simple SettlementAsClose = na
): series String
```
Overrides data modifiers on an existing ticker id, keeping the rest.
**Parameters**
| Name | Type | Default | Description |
| --- | --- | --- | --- |
| `ticker_id` | series String | | The ticker id to modify. |
| `session` | series Session | `na` | Session type. Optional. |
| `adjustment` | series Adjustment | `na` | Price adjustment. Optional. |
| `backadjustment` | simple BackAdjustment | `na` | Continuous-futures back-adjustment. Optional. |
| `settlement_as_close` | simple SettlementAsClose | `na` | Settlement-as-close. Optional. |
**Returns:** series String — A ticker id string usable with `request.security`.
---
### new {#new}
```navi
new(
market: series String,
ticker: series String,
session: series Session = Session.Regular,
adjustment: series Adjustment = Adjustment.None,
backadjustment: simple BackAdjustment = BackAdjustment.Inherit,
settlement_as_close: simple SettlementAsClose = SettlementAsClose.Inherit
): series String
```
Constructs a ticker id from a market and ticker with the given data modifiers (session, adjustment, etc.). Omitted modifiers use their defaults.
**Parameters**
| Name | Type | Default | Description |
| --- | --- | --- | --- |
| `market` | series String | | Market of the symbol (e.g. `symbol_info.market`). |
| `ticker` | series String | | Ticker name (e.g. `symbol_info.ticker`). |
| `session` | series Session | `Session.Regular` | Session type. Optional. |
| `adjustment` | series Adjustment | `Adjustment.None` | Price adjustment. Optional. |
| `backadjustment` | simple BackAdjustment | `BackAdjustment.Inherit` | Continuous-futures back-adjustment. Optional. |
| `settlement_as_close` | simple SettlementAsClose | `SettlementAsClose.Inherit` | Settlement-as-close. Optional. |
**Returns:** series String — A ticker id string usable with `request.security`.
---
### point_figure {#point_figure}
```navi
point_figure(
ticker_id: series String,
source: series PnfSource,
style: series BoxStyle,
param: series float,
reversal: series int
): series String
```
Creates a ticker identifier for requesting Point & Figure values.
**Parameters**
| Name | Type | Default | Description |
| --- | --- | --- | --- |
| `ticker_id` | series String | | The base ticker id (e.g. `symbol_info.tickerid`). |
| `source` | series PnfSource | | Source used to calculate boxes (Hl / Close). |
| `style` | series BoxStyle | | Box size assignment method. |
| `param` | series float | | ATR length, box size, or percentage, depending on `style`. |
| `reversal` | series int | | Reversal amount, in boxes. |
**Returns:** series String — A ticker id string usable with `request.security`.
---
### renko {#renko}
```navi
renko(
ticker_id: series String,
style: series BoxStyle = BoxStyle.Atr,
param: series float = 10,
request_wicks: series bool = false,
source: series RenkoSource = RenkoSource.Close
): series String
```
Creates a ticker identifier for requesting Renko values.
**Parameters**
| Name | Type | Default | Description |
| --- | --- | --- | --- |
| `ticker_id` | series String | | The base ticker id (e.g. `symbol_info.tickerid`). |
| `style` | series BoxStyle | `BoxStyle.Atr` | Box size assignment method (ATR / Traditional / PercentageLtp). |
| `param` | series float | `10` | ATR length, box size, or percentage, depending on `style`. |
| `request_wicks` | series bool | `false` | Whether Renko bricks include wick values. |
| `source` | series RenkoSource | `RenkoSource.Close` | Source used to calculate bricks (Close / OHLC). |
**Returns:** series String — A ticker id string usable with `request.security`.
---
### standard {#standard}
```navi
standard(ticker_id: series String): series String
```
Creates a ticker identifier for requesting standard chart data, unaffected by non-standard chart-type modifiers (Heikin Ashi, Renko, etc.).
**Parameters**
| Name | Type | Default | Description |
| --- | --- | --- | --- |
| `ticker_id` | series String | | The base ticker id to modify (e.g. `syminfo.tickerid`). |
**Returns:** series String — A ticker id string usable with `request.security`.
---
# timeframe
# timeframe
## Properties
### is_daily {#is_daily}
**Type:** input bool
Returns `true` if current resolution is a daily resolution, `false` otherwise.
---
### is_dwm {#is_dwm}
**Type:** input bool
Returns `true` if current resolution is a daily or weekly or monthly resolution, `false` otherwise.
---
### is_intraday {#is_intraday}
**Type:** input bool
Returns `true` if current resolution is an intraday (minutes or seconds) resolution, `false` otherwise.
---
### is_minutes {#is_minutes}
**Type:** input bool
Returns `true` if current resolution is a minutes resolution, `false` otherwise.
---
### is_monthly {#is_monthly}
**Type:** input bool
Returns `true` if current resolution is a monthly resolution, `false` otherwise.
---
### is_seconds {#is_seconds}
**Type:** input bool
Returns `true` if current resolution is a seconds resolution, `false` otherwise.
---
### is_ticks {#is_ticks}
**Type:** input bool
Returns `true` if current resolution is a ticks resolution, `false` otherwise.
---
### is_weekly {#is_weekly}
**Type:** input bool
Returns `true` if current resolution is a weekly resolution, `false` otherwise.
---
### main_period {#main_period}
**Type:** simple String
Returns the base timeframe chosen for the script itself.
Inside `request.*()` expressions this value still points to the outer script's timeframe rather than the temporary request timeframe.
---
### multiplier {#multiplier}
**Type:** simple int
Multiplier of resolution, e.g. '60' - 60, 'D' - 1, '5D' - 5, '12M' - 12.
**Type:** simple int
Multiplier of resolution, e.g. '60' - 60, 'D' - 1, '5D' - 5, '12M' - 12.
---
### period {#period}
**Type:** simple String
A String representation of the script's main timeframe.
If the script is an indicator that specifies a `timeframe` value in its declaration statement, this variable holds that value. Otherwise, its value represents the chart's timeframe. The String's format is "<quantity>[<unit>]", where <unit> is "T" for ticks, "S" for seconds, "D" for days, "W" for weeks, and "M" for months, but is absent for minutes. No <unit> exists for hours: hourly timeframes are expressed in minutes. The variable's value is: "10S" for 10 seconds, "30" for 30 minutes, "240" for four hours, "1D" for one day, "2W" for two weeks, and "3M" for one quarter.
**Type:** simple String
A String representation of the script's main timeframe or a requested timeframe.
## Functions
### change {#change}
```navi
change(timeframe: String): bool
```
Detects changes in the specified timeframe.
**Parameters**
| Name | Type | Default | Description |
| --- | --- | --- | --- |
| `timeframe` | String | | |
**Returns:** bool
---
### from_seconds {#from_seconds}
```navi
from_seconds(seconds: int): String
```
Converts seconds into a timeframe String.
**Parameters**
| Name | Type | Default | Description |
| --- | --- | --- | --- |
| `seconds` | int | | The number of seconds to convert. |
**Returns:** String — A timeframe String (e.g., 3600 returns "60", 86400 returns "D").
---
### in_seconds {#in_seconds}
```navi
in_seconds(timeframe: String = timeframe.period): simple int
```
Converts a timeframe String into seconds.
**Parameters**
| Name | Type | Default | Description |
| --- | --- | --- | --- |
| `timeframe` | String | `timeframe.period` | The timeframe String to convert. Defaults to the chart's timeframe. |
**Returns:** simple int — The number of seconds in one bar of the given timeframe. For example, "D" returns 86400, "60" returns 3600.
---
# ai
# AI Assistant
The **navi** skill gives your AI coding agent focused knowledge of the Navi language — syntax, execution model, standard library, and common patterns — so it can write correct, idiomatic `.nv` indicator and strategy scripts without needing to learn from scratch each session.
## What's included
The skill contains four reference files loaded on demand:
| File | Purpose |
|---|---|
| `syntax.md` | Surface syntax — declarations, control flow, functions, struct/enum/newtype, imports |
| `execution-model.md` | Bar-by-bar execution, type qualifiers (`const`/`input`/`simple`/`series`), `var`/`varip`, `na`, history references, avoiding repainting |
| `stdlib.md` | Built-in functions — prelude, `ta`/`math`/`str`, `Array`/`Map`/`Matrix`, drawing, `strategy` |
| `patterns.md` | Proven idioms — indicator/strategy/library skeletons, warmup guards, stateful accumulators, cross logic, pitfalls |
## Installation
Install from the `longbridge/navi` repository with the Skills CLI:
```bash
npx skills add longbridge/navi
```
To inspect the repository's available skills before installing:
```bash
npx skills add longbridge/navi --list
```
If your installer asks which skill to add, choose `navi`. You can also install it explicitly:
```bash
npx skills add longbridge/navi --skill navi
```
Alternatively, [download the packaged skill](/navi-skill.zip) and extract it into your agent's skills directory.
Install the standalone `navi` CLI as well so the AI agent can compile and run the scripts it writes.
macOS or Linux:
```bash
curl -fsSL https://navi-lang.org/install.sh | sh
```
Windows PowerShell:
```powershell
irm https://navi-lang.org/install.ps1 | iex
```
Verify the CLI is available:
```bash
navi --version
```
Update the installed skill when Navi documentation or APIs change:
```bash
npx skills update navi
```
The CLI contains no market data. The validation workflow below feeds `navi run` synthetic or real OHLCV data on stdin as NDJSON.
## Usage
Once installed, compatible AI coding agents can use the skill automatically when working with `.nv` files or when you ask about Navi.
```text
Write a complete Navi VWAP indicator with configurable upper and lower bands.
Save it as vwap_bands.nv and validate it with the navi CLI.
```
For better results, include:
- The script kind: indicator, strategy, or library
- Inputs and expected plots, signals, or orders
- Symbol or timeframe assumptions
- Repainting and warmup requirements
- The target `.nv` filename
## Recommended Workflow
1. Ask the agent for a complete `.nv` file, not an isolated fragment.
2. Use `snake_case` for filenames, variables, parameters, and functions.
3. Require the agent to validate the file with the standalone `navi` CLI:
```bash
navi check path/to/script.nv
```
4. Have the agent apply canonical formatting with `navi fmt path/to/script.nv`, or verify it with `navi fmt --check`.
5. When several files changed, validate them together — both commands accept files, directories, and glob patterns:
```bash
navi check "src/**/*.nv"
navi fmt src
```
6. Have the agent run the script when the task turns on what it computes, not just whether it compiles:
```bash
echo '{"type":"bar","data":[{"time":1700006400000,"close":103},{"time":1700092800000,"close":107}]}' \
| navi run path/to/script.nv
```
7. Use the validated script with the Longbridge CLI, App, or desktop client. The standalone `navi` CLI is primarily a development and debugging tool.
Do not accept a claim that a script was validated unless the agent ran the CLI successfully. A code block alone is not validation.
### Runtime behavior
`navi run` executes a script against data you supply, so runtime behavior can be checked without any market-data service. It bundles no data of its own — you provide it on stdin as NDJSON, one JSON object per line, and each bar's `plot()` values and any alerts come back on stdout the same way. Prefer these in order:
- `navi run`, feeding synthetic or previously captured OHLCV data. No account or network needed, and the numbers are reproducible.
- An installed and authenticated Longbridge CLI: `longbridge quant run` executes a script directly against Longbridge historical data.
- A Longbridge MCP server in the AI environment: request historical candlesticks with its market-data tools.
- The [Playground](/playground), which runs the script in the browser against sample candles.
Three things about `navi run` are worth knowing before writing a driver for it:
- **stdout is the script's output, stderr is navi's.** Plot values, alerts and the script's own `log.*()` calls all arrive on stdout, every line parsing as JSON. Compile diagnostics, protocol errors and timeouts go to stderr as plain text. Read them separately — merging them with `2>&1` corrupts the JSON stream.
- **Close stdin when you are done sending.** Past the history boundary the run stays open waiting for live data, so it will not finish on its own. Ctrl+C also shuts down cleanly, writing a final `done` line marked `"interrupted": true` and exiting 130.
- **A stream nobody answers is an error, not an empty result.** To say a symbol genuinely has no dividends, answer with an empty array instead of staying silent.
For a script that uses `request.security`, `request.dividends`, or `request.data`, navi asks for each stream with a `request` line and the driver answers by `id`:
```python
import json, subprocess
BARS = [{"time": 1700006400000 + i * 86400000, "close": 100 + i} for i in range(3)]
p = subprocess.Popen(["navi", "run", "script.nv"],
stdin=subprocess.PIPE, stdout=subprocess.PIPE, text=True)
def send(obj):
p.stdin.write(json.dumps(obj) + "\n")
p.stdin.flush()
rows, alerts = [], []
while True:
# An explicit readline loop: `for line in p.stdout` reads ahead and can
# block against a process that is waiting for your answer.
line = p.stdout.readline()
if not line:
break
msg = json.loads(line)
kind = msg["type"]
if kind == "request":
method = msg["method"]
data = BARS if method == "bar" else [] # [] means "genuinely none"
send({"type": method, "id": msg["id"], "data": data})
elif kind == "historyEnd":
p.stdin.close() # nothing more to send
elif kind == "bar":
rows.append(msg["values"])
elif kind == "alert":
alerts.append(msg["message"])
elif kind == "log":
print(msg["level"], msg["message"]) # the script's own output
elif kind == "error":
raise SystemExit(msg["message"])
elif kind == "done":
break
p.wait()
print(rows[-5:], alerts) # report a summary, not 5000 lines
```
A `strategy()` script also reports what it traded, one line per event, with the event's own kind as the line type — `orderFilled`, `tradeOpened`, `equitySnapshot`, and so on.
Nothing is filtered. Past the history boundary a bar re-executes on every update it receives, and each pass emits its own lines carrying the `state` it ran in, so narrowing is the reader's job: `jq 'select(.state != "history")'` for live output only, `jq 'select(.type == "orderFilled")'` for fills.
Run `navi run --help` for the full wire protocol: every line type with a literal example, the routing rules, and a complete request/response transcript.
### Online preview
After validation, an AI agent can generate a Playground preview by encoding the complete UTF-8 script as unpadded Base64URL and placing it in the `code` query parameter:
```text
https://navi-lang.org/playground?code=
```
Opening the link loads the script as an unsaved file and adds it to the chart. Base64URL uses `-` and `_` instead of `+` and `/`, with trailing `=` removed. Keep the source file alongside the link because browsers and chat clients limit URL length.
## Example Requests
```text
Review momentum_strategy.nv for repainting and series-state errors.
Fix the file, preserve its behavior, and run navi check when finished.
```
```text
Write a Navi RSI indicator, then run it with navi run over 30 synthetic daily
bars and show me the RSI value on each bar.
```
```text
Create a Navi library that exports EMA and crossover helpers.
Use Navi naming conventions, save it as moving_average_helpers.nv,
and return the exact navi check result.
```
The skill treats [navi-lang.org](/docs/) and its standard-library reference as the source of truth for current APIs.
---
# collections
# Collections
Navi provides three generic collection types:
| Type | Description |
|---|---|
| `Array` | Ordered, indexable sequence |
| `Matrix` | 2D table of rows × columns |
| `Map` | Key-value store |
Collections are **reference types** — assigning copies the reference, not the contents. Use `.copy()` for an independent copy.
Declare collections with `var` so they persist across bars:
```navi
var highs: Array = Array.new();
highs.push(high); // accumulates one value per bar
```
## Tuples
Tuples group multiple return values from functions. They cannot be stored in variables, passed as arguments, or used inside expressions — they must be immediately destructured:
```navi
fn calcBands(src, length, mult) {
let basis = ta.sma(src, length);
let dev = mult * ta.stdev(src, length);
(basis, basis + dev, basis - dev);
}
let (mid, upper, lower) = calcBands(close, 20, 2.0);
```
## `Array`
An ordered, zero-indexed sequence.
**Creating**
```navi
var a: Array = Array.new();
let b: Array = Array.new(5, 0.0); // pre-sized, filled with 0.0
let c: Array = Array.from(10, 20, 30);
let values = [1, 2, 3]; // array literal
```
**Reading and writing**
```navi
a.push(close); // append to end
a.unshift(close); // prepend to front
let last: float = a.last();
let first: float = a.first();
let val: float = a.get(2); // by index (negative counts from end)
a.set(2, 99.0);
a.insert(1, 42.0);
let removed: float = a.remove(1);
let popped: float = a.pop();
let shifted: float = a.shift();
let n: int = a.size();
```
**Searching**
```navi
let found: bool = a.includes(close);
let idx: int = a.indexof(close);
let last: int = a.lastindexof(close);
```
**Slicing and combining**
```navi
let sub: Array = a.slice(1, 4);
let both: Array = a.concat(b);
let dup: Array = a.copy();
a.reverse();
a.fill(0.0, 0, 3);
a.clear();
```
**Sorting**
```navi
a.sort();
a.sort(SortOrder.Descending);
let idx: Array = a.sort_indices();
```
**Statistics** (numeric arrays)
```navi
let total: float = a.sum();
let mean: float = a.avg();
let med: float = a.median();
let sd: float = a.stdev();
let hi: float = a.max();
let lo: float = a.min();
let rng: float = a.range();
```
**Iterating**
```navi
for v in vals {
total += v;
}
for (i, v) in vals {
log.info("{0}: {1}", i, v);
}
```
## `Map`
An unordered key-value store. Keys must be a primitive type or enum.
```navi
let counts = {"a": 1, "b": 2}; // map literal
var m: Map = Map.new();
m.put("open", open);
m.put("close", close);
let o: float = m.get("open");
let exists: bool = m.contains("close");
let count: int = m.size();
let old: float = m.remove("open");
let ks: Array = m.keys();
let vs: Array = m.values();
m.put_all(other);
m.clear();
let dup: Map = m.copy();
```
**Iterating**
```navi
for (k, v) in m {
log.info("{0} = {1}", k, v);
}
```
## `Matrix`
A two-dimensional table indexed by `[row, column]`.
```navi
let mat: Matrix = Matrix.new(3, 4, 0.0);
mat.set(0, 0, 1.5);
let v: float = mat.get(0, 0);
let r: int = mat.rows();
let c: int = mat.columns();
let row0: Array = mat.row(0);
let col1: Array = mat.col(1);
mat.add_row(na, Array.from(1.0, 2.0, 3.0, 4.0));
mat.add_col();
mat.remove_row();
mat.remove_col(0);
mat.reshape(2, 6);
let sub: Matrix = mat.subMatrix(0, 2, 0, 2);
let t: Matrix = mat.transpose();
mat.swap_rows(0, 1);
mat.swap_columns(0, 1);
mat.reverse();
mat.fill(0.0);
mat.sort();
let dup: Matrix = mat.copy();
```
**Math operations** (numeric matrices)
```navi
let total: float = mat.avg();
let hi: float = mat.max();
let lo: float = mat.min();
let s: Matrix = mat.sum(other);
let d: Matrix = mat.diff(other);
let p: Matrix = mat.multi(other);
let i: Matrix = mat.inv();
let det: float = mat.det();
let rk: int = mat.rank();
let tr: float = mat.trace();
let pw: Matrix = mat.pow(2);
```
---
# control-structures
# Control Structures
All control structures in Navi are **expressions** — they produce a value. The last expression evaluated in the executed branch or iteration is the returned value. This means `if`, `for`, `while`, and `switch` can all appear on the right-hand side of an assignment.
## `if` / `else if` / `else`
```navi
if close > open {
label.new(bar_index, high, "Bullish");
} else if close < open {
label.new(bar_index, low, "Bearish");
} else {
label.new(bar_index, close, "Doji");
}
```
### Returning a value from `if`
The last expression in each branch is the result. All branches must return the same type:
```navi
let x = if close > open {
close;
} else {
open;
};
plot(x);
```
With `else if`:
```navi
let x = if open > close {
5;
} else if high > low {
close;
} else {
open;
};
```
When the `else` block is omitted, the result is `na` (or `false` / `""` for bool/String) when the condition is false:
```navi
let x = if close > open {
close;
};
// x is na when close <= open
```
### Returning tuples from `if`
Each branch must return a tuple of the same structure:
```navi
let (v1, v2) = if close > open {
(high, close);
} else {
(close, low);
};
```
## `for` Loop
### Counting Form
```navi
let sum = 0.0;
for i = 0 to 9 {
sum += close[i];
}
let averageClose = sum / 10;
```
With a step:
```navi
for i = 0 to 20 by 2 {}
// i = 0, 2, 4, 6, ..., 20
```
Reverse loop with negative step:
```navi
for i = 10 to 0 by -1 {
arr.push(i);
}
// i = 10, 9, 8, ..., 0
```
### Collection Iteration (`for...in`)
Iterate over arrays with value only, or with both index and value:
```navi
var prices = Array.from(100.0, 200.0, 300.0);
// Value only
for value in prices {
log.info(String.from(value));
}
// Index and value (destructured)
for (index, value) in prices {
log.info(String.from(index) + ": " + String.from(value));
}
```
### Returning a value from `for`
A `for` loop returns the last expression evaluated in its final iteration. If no iterations execute, it returns `na`:
```navi
// Count how many OHLC values are greater than the SMA
let ohlcValues: Array = Array.from(open, high, low, close);
fn qtyGreaterThan(value, array) {
let result: int = 0;
for currentElement in array {
if currentElement > value {
result += 1;
}
result;
}
}
plot(qtyGreaterThan(ta.sma(close, 20), ohlcValues));
```
## `while` Loop
```navi
let i = 0;
let sum = 0.0;
while i < 10 {
sum += close[i];
i += 1;
}
```
### Returning a value from `while`
Like `for`, a `while` loop returns the last expression evaluated in its final iteration:
```navi
let i: int = 0;
let result: int = while i < 10 {
i += 1;
i * 2;
};
// result is 20 (last iteration: i = 10, 10 * 2 = 20)
```
## `break` and `continue`
- `break` exits the loop immediately. The loop returns the value of the last expression evaluated before `break`.
- `continue` skips the rest of the current iteration and proceeds to the next one.
```navi
for i = 0 to 99 {
if close[i] < 0 {
break // Exit the loop
} // Exit the loop
if na(close[i]) {
continue // Skip this iteration
} // Skip this iteration
}
// process close[i]
```
Using `break` and `continue` with loop return values:
```navi
let tempString: String = "";
let finalText: String = for number in randomArray {
if number == 8 {
break // exit loop; returns last evaluated expression
} else if number % 2 == 0 {
continue // skip even numbers
} // skip even numbers
tempString = tempString + String.from(number) + ", ";
};
// finalText holds the returned value after loop termination
```
## `switch`
### With Value
Match against a specific value:
Inline branches end with `,`; a brace-block branch omits the trailing `,`.
```navi
let dayName = switch day_of_week {
DayOfWeek.Monday => "Mon",
DayOfWeek.Tuesday => "Tue",
DayOfWeek.Wednesday => "Wed",
DayOfWeek.Thursday => "Thu",
DayOfWeek.Friday => "Fri",
=> "Weekend",
};
```
```navi
let i_maType: String = input.string(
"EMA",
"MA type",
options: [
"EMA",
"SMA",
"RMA",
"WMA"
]
);
let ma: float = switch i_maType {
"EMA" => ta.ema(close, 10),
"SMA" => ta.sma(close, 10),
"RMA" => ta.rma(close, 10),
=> ta.wma(close, 10),
};
plot(ma);
```
### Without Value (condition-based)
When no key expression is provided, each arm uses a boolean condition. The first matching arm executes:
```navi
let direction = switch {
close > open => "up",
close < open => "down",
=> "flat",
};
```
### Multi-statement branch
Use a brace block for multiple statements. No trailing `,` after `}`:
```navi
let label = switch dayOfWeek {
1 => "Mon",
2 => {
let s = "Tue";
s;
}
=> "other",
};
```
### Returning tuples from `switch`
```navi
let (v1, v2) = switch {
close > open => (high, close),
=> (close, low),
};
```
`switch` arms use `=>` to separate the condition from the body. The default arm has no condition before `=>`.
## Next Steps
- [Functions & Methods](/docs/functions-and-methods) — defining custom functions
- [Custom Types & Enums](/docs/custom-types) — user-defined types
---
# custom-types
# Custom Types & Enums
## User-Defined Types (UDTs)
Define custom types with the `struct` keyword. Fields must have explicit types and can have optional default values:
```navi
struct Order {
id: int,
symbol: String,
price: float = na,
varip updateCount: int = 0,
}
```
Fields can use:
- An explicit type (required)
- An optional default value with `=`
- An optional `varip` declaration mode (makes the field persist across intrabar updates)
### Creating Instances
Use `.new()` to create an instance:
```navi
let myOrder: Order = Order.new(id: 1, symbol: "AAPL");
```
### Accessing and Modifying Fields
```navi
let orderPrice = myOrder.price;
myOrder.price = 155.0;
myOrder.quantity = 200;
```
### Copying
```navi
let clone: Order = Order.copy(myOrder);
clone.price = 160.0;
```
### Methods on Types
```navi
struct Position {
entry: float,
size: float,
isLong: bool = true,
}
method pnl(self: Position, currentPrice: float) {
let diff = currentPrice - self.entry;
self.isLong ? diff * self.size : -diff * self.size;
}
method isProfit(self: Position, currentPrice: float) {
self.pnl(currentPrice) > 0;
}
let pos = Position.new(entry: 100.0, size: 10.0);
if pos.isProfit(close) {
label.new(bar_index, high, String.from(pos.pnl(close), "#.##"));
}
```
### `varip` on Type Fields
Individual fields can use `varip` to persist across intrabar updates while other fields still roll back:
```navi
struct Counter {
bars: int = 0,
varip ticks: int = 0,
}
var counter: Counter = Counter.new();
counter.bars += 1; // subject to rollback on unconfirmed bars
counter.ticks += 1; // NOT subject to rollback
```
### Generic UDTs
UDTs can declare one or more type parameters. The parameter names stand for
any type when the UDT is instantiated:
```navi
struct Pair {
first: A,
second: B,
}
let p: Pair = Pair.new(first: 42, second: "hello");
```
Field types may themselves be parameterized — for example, holding a collection of `T`:
```navi
struct Stack {
items: Array,
count: int = 0,
}
method push(self: Stack, value: T) {
self.items.push(value);
self.count += 1;
}
method pop(self: Stack): T {
self.count -= 1;
self.items.pop();
}
var s: Stack = Stack.new();
s.push(close);
s.push(open);
```
The compiler monomorphizes each instantiation — `Stack` and `Stack` produce separate, correctly-typed objects with proper GC tracking for reference fields.
## Enums
Define enumerations with the `enum` keyword. Variants are simple names (no associated data):
```navi
enum Direction {
Long,
Short,
Both = "Both Directions",
}
```
### Using Enums
Access variants via the enum name:
```navi
let d: Direction = Direction.Long;
if d == Direction.Long {
strategy.entry("L", Direction.Long);
} else if d == Direction.Short {
strategy.entry("S", Direction.Short);
}
```
## Import and Export
### Exporting
Mark functions, types, and enums with `export` to make them visible to importing modules:
```navi
library("MyLib");
export struct Config {
length: int,
multiplier: float,
}
export fn calcSMA(src: series float, length: simple int) {
ta.sma(src, length);
}
export enum Side {
Left,
Right,
}
```
### Importing
```navi
indicator("My Indicator");
use MyLib as lib;
let config = lib.Config.new(length: 20, multiplier: 2.0);
let sma = lib.calcSMA(close, config.length);
plot(sma);
```
Access exported members via the module name:
```navi
use utils;
utils.add(1, 2); // call exported function
let obj: utils.MyType = na; // use exported type
let value = utils.MyEnum.A; // access exported enum variant
```
## Newtype Declarations
Navi supports the `type Name = underlying_type;` syntax to create a distinct type backed by an existing type. This allows you to define domain-specific types without creating new structures:
```navi
type MyInt = int;
let a: MyInt = 10; // accepts the underlying type's values
```
Newtypes can be layered:
```navi
type MyInt = int;
type SpecialInt = MyInt;
let x: SpecialInt = 42; // OK
```
## Compiler-Special Types
The following types are used by Navi's standard library to implement certain advanced built-in functions. You will not normally use them in your own scripts — they appear in stdlib source and are handled transparently when you call functions like `input.source`, `request.security`, or `max_bars_back`.
### `expression`
Allows a function to receive an **unevaluated AST node** instead of a computed value. Used by `input.source()` to know which variable the user passed in, so the UI can display it by name.
```navi
let src = input.source(defval: close);
// `close` is captured as an expression, not evaluated to a number.
// The settings UI shows "Close" as the default source option.
```
### `instructions`
Allows a function to receive a **compiled code block** that is re-executed in a different context. Used by `request.security()` to run expressions on a different symbol or timeframe.
```navi
// Simple series — re-evaluated in the AAPL/1D context each bar:
let aapl_close = request.security("AAPL", "1D", close);
// Compound expression — entire expression re-executed in context:
let aapl_sma = request.security("AAPL", "1D", ta.sma(close, 14));
```
### `variableref`
Allows a function to receive a **compile-time reference to a variable or series**. The compiler resolves the reference at compile time and passes metadata to the native function. Used by `max_bars_back()` to extend the history buffer for a specific series.
```navi
// Extend the history buffer for a built-in series:
max_bars_back(close, 500);
// Or for a user-defined series variable:
let myAvg: series float = ta.sma(close, 20);
max_bars_back(myAvg, 200);
```
## Next Steps
- [Functions & Methods](/docs/functions-and-methods) — function definitions, static methods, operator overloading, and more
- [Standard Library](/api/stdlib/) — explore built-in functions
---
# doc-annotations
# Documentation Annotations
Navi supports special comment tags that attach documentation to declarations. These annotations are used by the LSP (for hover and completions) and by the documentation generator.
Both `//@tag` and `// @tag` (with a space after `//`) formats are supported.
## Available Tags
| Tag | Placement | Description |
|-----|-----------|-------------|
| `@description` | File header (before any declarations) | Adds a top-level description for the library |
| `@function` | Above a function declaration | Adds a custom description for the function |
| `@param` | Above a function declaration | Adds a description for a parameter. Specify the parameter name, then its description |
| `@returns` | Above a function declaration | Adds a description for the return value |
| `@type` | Above a type or newtype declaration | Adds a custom description for the type |
| `@enum` | Above an enum declaration | Adds a custom description for the enum |
| `@field` | Above a type or enum declaration | Adds a description for a field or variant. Specify the field name, then its description |
| `@variable` | Above a variable declaration | Adds a custom description for the variable |
| `@example` | Above a function or type declaration | Opens a code example block (closed by `@endexample`) |
| `@endexample` | Closes an `@example` block | — |
| `@see` | Above a function or type declaration | Adds a "See Also" cross-reference to a related symbol |
All tags support **multi-line continuation**: lines starting with `//` (without a `@` tag) immediately after a tag line are appended to that tag's text.
## Documenting Functions
Use `@function`, `@param`, and `@returns` to document function declarations:
```navi
// @function Outputs a label with `labelText` on the bar's high.
// @param labelText (series String) The text to display on the label.
// @returns The drawn label ID.
export fn drawLabel(labelText: String) {
label.new(bar_index, high, text: labelText);
}
```
`@param` and `@returns` can appear either before or after the `@function` tag:
```navi
// @param series Series of values to process.
// @param length Number of bars (length).
// @function Arnaud Legoux Moving Average.
//
// It uses Gaussian distribution as weights for moving average.
export fn alma(series: series float, length: simple int): series float {
_
}
// ...
```
### Multi-line Descriptions
Continuation lines (starting with `//` but without `@`) extend the previous tag's description:
```navi
// @function Calculates the percentage difference
// from the base price to the target price.
// @param basePrice The start price
// used as the reference point.
// @param price The end price.
// @returns The signed deviation percentage.
export fn calcDeviation(basePrice: float, price: float) {
100 * (price - basePrice) / basePrice;
}
```
## Documenting Types
Use `@type` and `@field` to document type declarations:
```navi
// @type A point on a chart.
// @field index The index of the bar where the point is located, i.e., its `x`
// coordinate.
// @field price The price where the point is located, i.e., its `y` coordinate.
struct Point {
index: int,
price: float,
}
```
The `@type` tag also works for newtype declarations:
```navi
// @type Handle for a label drawing object.
export type label = int;
```
## Documenting Enums
Use `@enum` and `@field` to document enum declarations and their variants:
```navi
// @enum Represents a trading direction.
// @field Long A long (buy) direction.
// @field Short A short (sell) direction.
// @field Both Both directions.
export enum Direction {
Long,
Short,
Both,
}
```
## Documenting Variables
Use `@variable` to document variable declarations:
```navi
// @variable The highest price over the last 20 bars.
let highest20: float = ta.highest(high, 20);
// @variable Tracks cumulative volume since the session started.
var cumVol: float = 0.0;
```
## Code Examples
Use `@example` / `@endexample` pairs to attach runnable code examples to a function or type. Each line inside the block is a plain `//` comment; the `// ` prefix (with the space) is stripped automatically. Multiple blocks are allowed — each becomes a separate example.
```navi
// @function Calculates the percentage difference between two prices.
// @param base The reference price.
// @param price The target price.
// @returns The signed deviation as a percentage.
// @example
// // Compare today's close to yesterday's close
// let deviation = calcDeviation(close[1], close);
// plot(deviation, title: "Deviation %");
// @endexample
export fn calcDeviation(base: float, price: float) {
100 * (price - base) / base;
}
```
Multiple examples are each wrapped in their own block:
```navi
// @function Returns the simple moving average of `src` over `length` bars.
// @example
// // Basic 20-bar SMA
// plot(ta.sma(close, 20));
// @endexample
// @example
// // Crossover signal using two SMAs
// let fast = ta.sma(close, 9);
// let slow = ta.sma(close, 21);
// plot_shape(ta.cross_over(fast, slow), style: Shape.LabelUp);
// @endexample
export fn sma(src: series float, length: simple int): series float {
_
}
```
Examples are shown in the **LSP hover** tooltip in VS Code.
## See Also Links
Use `@see` above a function, method, property, or type declaration to link related symbols. Each `@see` line adds one cross-reference entry. These appear in a **See Also** section in the API reference dialog and in the generated documentation pages.
```navi
// @function Exponential Moving Average.
// @see func:ta.sma
// @see func:ta.wma
export fn ema(series: series float, length: simple int): series float { ... }
```
The reference syntax is the same as for inline cross-references:
| Syntax | Resolves to |
|--------|-------------|
| `@see sma` | Bare name — resolved in the current module, then prelude, then globally |
| `@see func:ta.sma` | The `sma` function in the `ta` module |
| `@see type:Color` | The `Color` type |
| `@see Array.push` | The `push` method of the `Array` type |
One reference per `@see` line. `@see` is supported on functions, methods, properties, and types; it is not supported on variables.
## Cross-Reference Links
Inside any description text, you can write `` [`name`] `` to create a cross-reference link to another symbol. In the API reference dialog and the generated documentation pages, these render as clickable links that navigate to the target symbol.
```navi
// @type Handle for a plot created by [`func:plot`].
export type plot = int;
// @function Fills the area between two [`func:plot`] handles.
// @param hline1 The first horizontal line handle (from [`func:hline`]).
// @returns An hline handle that can be used with [`fill`].
```
**Syntax:**
| Syntax | Resolves to |
|--------|-------------|
| `` [`fill`] `` | Current module's `fill`, or prelude's `fill`, or global search |
| `` [`BarmergeGaps.Off`] `` | `BarmergeGaps.Off` (enum variant) |
| `` [`LineStyle.Solid`] `` | The `Solid` variant of the `LineStyle` enum (links to the enum type) |
| `` [`variant:LineStyle.Solid`] `` | Explicitly an enum variant (same target, clearer intent) |
| `` [`func:plot`] `` | The `plot` **function** (excludes the `plot` type) |
| `` [`type:hline`] `` | The `hline` **type** (excludes the `hline` function) |
| `` [`enum:LineStyle`] `` | An enum named `LineStyle` |
Qualifier prefixes (`func`, `type`, `enum`) disambiguate names that exist as both a function and a type in the same module.
For dotted references, the resolver first checks if the left side is a **module** with the right side as a member. If not found, it checks if the left side is an **enum type** with the right side as a variant name — in which case the link navigates to the enum type. This means both `` [`BarmergeGaps.Off`] `` (enum variant) and `` [`LineStyle.Solid`] `` (enum variant) work as expected.
## Editor Support
When documentation annotations are present, the Navi LSP uses them to provide:
- **Hover information** — shows the description, parameters, return value, and field docs when hovering over a symbol
- **Completion details** — shows the summary in autocomplete suggestions
- **Document symbols** — includes the summary in the outline view
## Library Documentation
For exported libraries, documentation annotations are especially important. The documentation generator (`navi-docgen`) extracts these annotations to produce API reference pages.
Use `@description` in the file header to add a top-level description for the library itself. It must appear before any declarations:
```navi
// @description Provides utilities for calculating volatility bands.
//
// Includes customizable Bollinger Bands and Keltner Channels.
library("MyLib")
```
Full example:
```navi
library("MyLib");
// @type Configuration for a custom indicator.
// @field length The lookback period.
// @field multiplier The standard deviation multiplier.
export struct Config {
length: int = 14,
multiplier: float = 2.0,
}
// @function Calculates a custom band around a moving average.
// @param src The source series.
// @param config The indicator configuration.
// @returns The upper band value.
export fn upperBand(src: series float, config: Config) {
let basis = ta.sma(src, config.length);
basis + config.multiplier * ta.stdev(src, config.length)
}
```
---
# examples
# Examples
This page walks through two complete Navi scripts with line-by-line explanations. Each example is designed to illustrate core language features in a realistic context.
## Example 1 — SMA Crossover Indicator
This indicator plots a fast and a slow simple moving average and marks crossover and crossunder events on the chart. It covers variables, series, the `ta` module, `plot`, and `plot_shape`.
- [Simple Moving Average (SMA)](https://en.wikipedia.org/wiki/Moving_average#Simple_moving_average)
```navi
// ① Declare this script as an indicator.
// - title : displayed in the chart legend
// - overlay=true : draw on top of the price candles (not in a separate pane)
indicator("SMA Crossover", overlay: true);
// ② User-configurable inputs.
// input.int() creates an integer input that appears in the script settings panel.
// The second argument is the default value; "title" labels it in the UI.
let fastLen = input.int(9, title: "Fast Length");
let slowLen = input.int(21, title: "Slow Length");
// ③ Compute the two SMA series.
// These are series: one value is produced per bar.
let fast = ta.sma(close, fastLen);
let slow = ta.sma(close, slowLen);
// ④ Detect crossover and crossunder events.
// ta.cross_over(a, b) → true on the bar where a crosses above b
// ta.cross_under(a, b) → true on the bar where a crosses below b
let crossUp = ta.cross_over(fast, slow);
let crossDown = ta.cross_under(fast, slow);
// ⑤ Plot the two moving averages as continuous lines.
// line_width=2 makes them slightly thicker than the default 1.
plot(fast, title: "Fast SMA", color: Color.BLUE, line_width: 2);
plot(slow, title: "Slow SMA", color: Color.ORANGE, line_width: 2);
// ⑥ Mark bullish crossovers with an upward triangle below the bar.
// plot_shape only draws on bars where the first argument is true.
plot_shape(crossUp,
title: "Bullish Cross",
style: Shape.TriangleUp,
location: Location.BelowBar,
color: Color.GREEN,
size: Size.Small);
// ⑦ Mark bearish crossunders with a downward triangle above the bar.
plot_shape(crossDown,
title: "Bearish Cross",
style: Shape.TriangleDown,
location: Location.AboveBar,
color: Color.RED,
size: Size.Small);
// ⑧ Color the chart background on bullish or bearish cross bars for emphasis.
// Color.new(c, transp) creates a transparent version of the color (0=opaque, 100=invisible).
// The ternary operator ?: picks the color based on which event occurred.
let bgColor = crossUp ? Color.new(Color.GREEN, 85) :
crossDown ? Color.new(Color.RED, 85) : na;
bg_color(bgColor);
```
### Key concepts illustrated
| Concept | Where |
|---|---|
| Script declaration | `indicator(...)` — line ① |
| User inputs | `input.int` — line ② |
| `series` variables | `fast`, `slow`, `crossUp`, `crossDown` — lines ③④ |
| `ta` module | `ta.sma`, `ta.cross_over`, `ta.cross_under` — lines ③④ |
| Plotting lines | `plot(...)` — line ⑤ |
| Plotting shapes | `plot_shape(...)` — lines ⑥⑦ |
| Transparent colors | `Color.new(c, transp)` — line ⑧ |
| Ternary operator | `c ? a : b` — line ⑧ |
| `na` as "no value" | `na` used to skip background coloring — line ⑧ |
---
## Example 2 — Bollinger Bands Strategy
This strategy enters long when price closes above the upper band and exits when it falls back below the middle band (and vice-versa for the short side). It covers `strategy()`, `ta.bb`, tuple destructuring, the history operator, and `strategy.entry` / `strategy.close`.
- [Bollinger Bands](https://en.wikipedia.org/wiki/Bollinger_Bands)
```navi
// ① Declare this script as a strategy.
// - default_qty_type : use a fixed number of contracts/shares per trade
// default_qty_value : trade 1 unit by default
strategy(
"Bollinger Bands Breakout",
default_qty_type: DefaultQtyType.Fixed,
default_qty_value: 1
);
// ② Compute Bollinger Bands.
// ta.bb returns a tuple: (middle, upper, lower).
// The (a, b, c) = ... syntax destructures the tuple into three variables.
let (basis, upper, lower) = ta.bb(close, 20, 2.0);
// ③ Entry conditions.
// close[1] references the *previous* bar's close (history operator []).
// Combining the current bar with the prior bar detects the exact crossover bar.
let longEntry = close > upper and close[1] <= upper[1];
let shortEntry = close < lower and close[1] >= lower[1];
// ④ Exit conditions: price crosses back through the middle band.
let longExit = close < basis;
let shortExit = close > basis;
// ⑤ Issue strategy orders.
// strategy.entry opens a position; strategy.close closes it by trade ID.
if longEntry {
strategy.entry("Long", Direction.Long);
}
if shortEntry {
strategy.entry("Short", Direction.Short);
}
if longExit {
strategy.close("Long");
}
if shortExit {
strategy.close("Short");
}
```
### Key concepts illustrated
| Concept | Where |
|---|---|
| Strategy declaration | `strategy(...)` — line ① |
| Tuple destructuring | `let (basis, upper, lower) = ta.bb(...)` — line ② |
| `ta.bb` | Bollinger Bands computation — line ② |
| History operator `[]` | `close[1]`, `upper[1]` — line ③ |
| Boolean series | `longEntry`, `shortEntry`, `longExit`, `shortExit` — lines ③④ |
| `if` statement | Strategy order blocks — line ⑤ |
| `strategy.entry` / `strategy.close` | Opening and closing trades — line ⑤ |
---
## Further Reading
- [Language Basics](/docs/language-basics) — operators, literals, the history operator
- [Variables & Qualifiers](/docs/types-and-variables) — `var`, type qualifiers, `na`
- [Control Structures](/docs/control-structures) — `if`, `for`, `while`, `switch`
- [Functions & Methods](/docs/functions-and-methods) — defining and calling functions
- [Standard Library](/api/stdlib/) — `ta`, `math`, `str`, `strategy`, and more
---
# functions-and-methods
# Functions & Methods
## Function Definitions
All functions use brace blocks. The last expression in the body is the return value — there is no `return` keyword:
```navi
fn double(x) {
x * 2;
}
fn smaCustom(src, length) {
let sum = 0.0;
for i = 0 to length - 1 {
sum += src[i];
}
sum / length;
}
```
### Functions Returning Tuples
```navi
fn calcBands(src, length, mult) {
let basis = ta.sma(src, length);
let dev = mult * ta.stdev(src, length);
(basis, basis + dev, basis - dev);
}
let (mid, upper, lower) = calcBands(close, 20, 2.0);
```
> **Note:** In Navi, tuples may only appear as function return values and must be immediately destructured on assignment. They cannot be stored in variables, passed as arguments, or used inside other expressions.
### Default Parameters
```navi
fn myPlot(src, length = 14, title = "Default") {
let sma = ta.sma(src, length);
plot(sma, title);
sma;
}
```
### Named Arguments
When calling functions, you can use named arguments:
```navi
plot(close, title: "Close", color: Color.BLUE, line_width: 2);
```
When a variable of the same name is already in scope, leave the value off —
`title:` is shorthand for `title: title`:
```navi
let title = "Close";
let color = Color.BLUE;
plot(close, title:, color:); // same as title: title, color: color
plot(close, title:, color: Color.RED); // mix freely with explicit values
```
## Function Overloading
Multiple functions can share the same name if they have different parameter types:
```navi
fn format(x: int) {
String.from(x);
}
fn format(x: float) {
String.from(x, "#.##");
}
fn format(x: String) {
x;
}
```
## Methods
Methods are functions whose first parameter is the receiver (`self`). They support two equivalent call forms:
```navi
method double(self: int) {
self * 2;
}
let x = 5;
x.double(); // dot-call — receiver on the left
double(x); // free-function call — receiver as first argument (UFCS)
```
Both forms are interchangeable. Use whichever reads more naturally for your context.
Methods work with custom types:
```navi
struct Position {
entry: float,
size: float,
}
method pnl(self: Position, currentPrice: float) {
(currentPrice - self.entry) * self.size;
}
method isProfit(self: Position, currentPrice: float) {
self.pnl(currentPrice) > 0;
}
let pos = Position.new(entry: 100.0, size: 10.0);
if pos.isProfit(close) {
label.new(bar_index, high, String.from(pos.pnl(close), "#.##"));
}
```
## No Recursive Calls
Navi **does not allow recursion**. A function cannot call itself, either directly or indirectly through other functions. The compiler rejects any call cycle at compile time:
```navi
// ERROR — direct recursion is not allowed
fn factorial(n) {
n <= 1 ? 1 : n * factorial(n - 1);
}
// ERROR — indirect recursion is also rejected
fn isEven(n) {
n == 0 ? true : isOdd(n - 1);
}
fn isOdd(n) {
n == 0 ? false : isEven(n - 1);
}
```
This is a fundamental language constraint, not an implementation limitation. Use `for` or `while` loops for iterative computation instead:
```navi
fn factorial(n) {
let result = 1;
for i = 2 to n {
result *= i;
}
result;
}
```
## Explicit Return Types
Navi supports annotating a return type before the function name for stricter type checking:
```navi
fn greet(name: String): String {
"Hello, " + name;
}
fn average(a: float, b: float): float {
(a + b) / 2.0;
}
```
This also works with methods:
```navi
method isPositive(self: float): bool {
self > 0;
}
```
## Generic Functions
Navi allows type parameters declared with `<...>` after the function name:
```navi
fn identity(value: T) {
value;
}
fn first(arr: Array) {
arr.get(0);
}
method contains(self: Array, value: T) {
self.indexof(value) >= 0;
}
```
Generic functions allow you to write reusable code that works with multiple types.
### Type Argument Inference
Most of the time you don't write the type arguments — Navi infers them.
**From arguments.** When a type parameter appears in a parameter type, it is inferred from the argument you pass:
```navi
fn first(arr: Array): T {
arr.get(0);
}
let x = first([1, 2, 3]); // T inferred as int
```
**From the surrounding context.** When a type parameter appears only in the *return* type, there is no argument to infer it from. Navi then infers it from the context — a variable's declared type, or the expected type at an argument position:
```navi
fn make(): T {
na;
}
fn scale(x: float): float {
x * 2.0;
}
let a: float = make(); // T inferred as float (from the annotation)
let b: int = make(); // T inferred as int
let c = scale(make()); // T inferred as float (scale's parameter is float)
```
**Explicitly.** When there is no context to infer from, give the type argument after the function name with `<...>` (there is no `::` before it):
```navi
let n = make(); // T given explicitly
```
A return-only type parameter with neither context nor an explicit argument is an error:
```navi
let a = make(); // ERROR: cannot infer generic type `T`
```
## Variadic Parameters
Navi allows the last parameter to be variadic with `...`:
```navi
fn sum(first: int, rest: int...) {
first + rest;
}
```
The variadic parameter must be the last one in the parameter list.
## Properties
The `property` keyword declares a function that cannot have parameters and is called without parentheses, making it look like a variable or property access:
```navi
property size() {
42;
}
// Access as a variable — no parentheses:
let value = size; // 42
// Calling with parentheses is an ERROR:
let value = size(); // error: function `size` not defined
```
**Examples from the standard library:**
```navi
// Candlestick data (prelude/candlestick.1.nv)
export property open(): series float {
@native.candlestick(1);
}
export property close(): series float {
@native.candlestick(4);
}
export property hl2(): series float {
(high + low) / 2;
}
// Constants (stdlib/math.1.nv)
export property pi(): const float {
3.1415926535897932;
}
```
Properties allow Navi's standard library to expose built-in values like `close`, `open`, `math.PI`, and `color.RED` as properties in Navi source code.
## Static Methods on Types
The `staticmethod` keyword defines a static method associated with a specific object type. Static methods are called on the type itself, not on an instance:
```navi
struct AB {
a: int,
}
staticmethod(AB) add(a: int, b: int): int {
a + b;
}
// Call on the type name:
let result = AB.add(20, 5); // 25
```
Static methods can only be defined for **struct or newtype** types, not for enums or primitive types.
**Examples from the standard library:**
```navi
// Factory methods for chart.Point (stdlib/chart.1.nv)
export struct Point {
index: int,
time: int,
price: float,
}
export staticmethod(Point) now(price: float = close): Point {
Point.new(bar_index, time_now, price);
}
export staticmethod(Point) from_time(time: int, price: float): Point {
Point.new(na, time, price);
}
```
These are called as `chart.Point.now()` and `chart.Point.from_time(time, price)`.
## Static Properties on Types
The `staticproperty` keyword is like `staticmethod`, but the accessor takes no parameters and is referenced **without parentheses** — just like a regular `property`:
```navi
struct Counter {
value: int,
}
staticproperty(Counter) zero(): Counter {
Counter.new();
}
// Access without ():
let c = Counter.zero;
```
`staticproperty` can only be defined for **struct or newtype** types, not for enums or primitive types.
| | `staticmethod` | `staticproperty` |
|---|---|---|
| Parameters | Yes | None |
| Call syntax | `Type.name(args)` | `Type.name` |
## Operator Overloading
The `operator` keyword defines custom behavior for arithmetic operators on user-defined types:
```navi
struct Vec2 {
x: float,
y: float,
}
operator+(a: Vec2, b: Vec2): Vec2 {
Vec2.new(a.x + b.x, a.y + b.y);
}
operator-(a: Vec2, b: Vec2): Vec2 {
Vec2.new(a.x - b.x, a.y - b.y);
}
// Now you can use the operators naturally:
let a: Vec2 = Vec2.new(1, 2);
let b: Vec2 = Vec2.new(3, 4);
let c: Vec2 = a + b; // Vec2.new(4, 6)
```
Supported operators: `+`, `-`, `*`, `/` (no space between `operator` and the symbol). Multiple overloads for different operand types are allowed.
## Built-in Functions
Navi provides many built-in functions:
```navi
// Plotting
plot(close, "Close", color.BLUE);
plot_shape(close > open, style: Shape.TriangleUp);
bg_color(close > open ? color.new(color.GREEN, 90) : na);
// Technical Analysis
let sma = ta.sma(close, 20);
let ema = ta.ema(close, 12);
let (macdLine, signal, hist) = ta.macd(close, 12, 26, 9);
let rsi = ta.rsi(close, 14);
// Math
let rounded = math.round(close, 2);
let maxVal = math.max(open, close);
// String operations
let text = String.from(close, "#.##");
// Input
let length = input.int(14, "RSI Length", minval: 1);
let src = input.source(close, "Source");
```
## Next Steps
- [Custom Types & Enums](/docs/custom-types) — user-defined types, enums, and newtype declarations
- [Standard Library](/api/stdlib/) — explore the standard library
---
# history-reference
# History Reference
In Navi, every expression is evaluated once per bar, producing a time series of values. The `[]` operator accesses the value that an expression produced on a **previous bar** — not just built-in variables, but any expression:
```navi
let previousClose = close[1]; // close price one bar ago
let twoBarsAgo = high[2]; // high price two bars ago
let prevSma = ta.sma(close, 14)[1]; // SMA value from the previous bar
let prevEma = ta.ema(close, 10)[3]; // EMA value from 3 bars ago
let prevRange = (high - low)[1]; // bar range from the previous bar
let myValue = close * volume;
let prevMyValue = myValue[1]; // previous bar's value of myValue
```
> **Key concept:** `ta.sma(close, 14)[1]` does **not** recompute the SMA — it returns the value that was already calculated when the script ran on the previous bar.
On early bars where insufficient history exists, the result is `na`. The offset can be a series expression:
```navi
let lookback: int = input.int(5, "Lookback");
let pastClose = close[lookback];
```
## How Much History a Script Needs
The engine works out how far back a script reaches by reading the script, and
keeps exactly that much. A script whose deepest read is `close[19]` retains
twenty bars — not because of a setting, but because twenty is what it uses.
The number is published, so whoever fetches the data knows what to send. From
the CLI it is `sessionInfo.script.requiredHistory`; from the chart and
playground it arrives on the same session info. It has three states, because a
number alone would not say whether it is an answer:
```json
{"type": "exact", "bars": 20}
{"type": "atLeast", "bars": 1}
{"type": "unknown"}
```
`exact` — send that many and the values are what they would be with any more.
`ta.sma(close, 20)` reports 20 and means it.
`atLeast` — a floor. The script carries state between bars, or reads its own
position in the feed, so its output keeps moving as more history arrives:
```navi
plot(ta.ema(close, 20)); // atLeast, 1 bar
```
An EMA keeps its running value in a `var`, which survives the bar without any
history buffer — so it reads nothing back, and reports 1. Its value still
settles over hundreds of bars as the first one's influence decays. How many is a
property of the arithmetic rather than of the source, so nothing claims to know;
send the floor plus whatever warm-up you consider enough.
`unknown` — nothing was worked out; send as much as you have.
The engine keeps only what it needs in every case, so a long backfill costs
nothing beyond the fetch itself.
### When It Cannot Be Worked Out
Some depths cannot be known ahead of time — an index computed from the bars
themselves, or a length that is not linear in its inputs:
```navi
let n = int(volume) / 1000;
plot(close[n]); // how deep is this? nobody knows until it runs
```
`navi check` points at the statement and says why. The engine then keeps only
what it could establish, and a read that reaches past that **fails with an
error naming the depth to declare** — it does not quietly return `na` on some
later bar, far from the cause.
Declaring the depth is how you answer:
```navi
let length = input.int(20, "Length");
max_bars_back(close, length + 32); // may be an expression over inputs
```
A declaration is a promise from the author about what the compiler could not
see, so it is only needed where the compiler said so. Where a bound *was*
proved, the proof already covers every read and a declaration adds nothing.
`indicator(max_bars_back: N)` says the same thing for the whole script.
`max_bars_back(v, N)` is usually better: it names the series that needs the
depth, and it also caps that series at `N`, so declaring less than a script
reads truncates it.
## Next Steps
- [Variables & Qualifiers](/docs/types-and-variables) — `var`, type qualifiers, `na`
- [Collections](/docs/collections) — array, map, matrix
---
# index
# Introduction
**Navi** is a scripting language for writing technical analysis indicators and trading strategies. It is compatible with PineScript v6 syntax and runs on the Longbridge platform via the `longbridge` CLI.
## What You Can Build
- **Indicators** — plot series, shapes, labels, lines, and tables on charts
- **Strategies** — define entry/exit rules and run backtests against historical data
- **Libraries** — write reusable functions and types that other scripts can import
## Language Design
Navi is a statically typed, compiled language. Type errors are caught before the script ever runs. The compiler performs multiple optimization passes — constant folding, dead code elimination, and algebraic simplification — before generating bytecode, so the runtime only processes already-optimized instructions. For workloads that demand even higher throughput, an optional JIT compiler (powered by Cranelift) translates bytecode to native machine code at runtime.
Navi uses a **streaming computation model**: market data flows in bar by bar, and the engine processes each candlestick incrementally — from the oldest historical bar to the most recent, and continuously as new real-time bars arrive. The same script runs identically over history and live data, with no distinction in code. All market data — `close`, `open`, `high`, `low`, `volume` — is a *series* that automatically tracks its full history. Reference any past value with `close[1]` (one bar back) or `close[N]` (N bars back). This streaming design keeps memory usage low and indicator logic concise: write the calculation for the current bar, and history takes care of itself.
## PineScript v6 Syntax Compatibility
The `navi` CLI is compatible with PineScript v6 syntax. Save the source as a `.pine` file and pass `--pine` to compile or run it directly. See [Quick Start](/docs/quick-start#running-pinescript-files) for the command and [Language Basics](/docs/language-basics) for Navi syntax.
## Next Steps
- [Install](/docs/install) — choose Longbridge App, desktop, Longbridge CLI, or the local development CLI
- [Quick Start](/docs/quick-start) — write and validate your first indicator
- [Language Basics](/docs/language-basics) — learn Navi syntax
- [Examples](/docs/examples) — study complete indicators and strategies
---
# install
# Install and Use Navi
Navi can be used in several environments. Choose the one that matches your workflow:
| Environment | Best for |
| --- | --- |
| Longbridge App or desktop client | Using indicators and strategies directly on trading charts |
| Longbridge CLI | Running scripts with Longbridge market data, automation, screening, and backtests |
| `navi` CLI | Local authoring, formatting, type checking, debugging, and CI |
For regular use, prefer the Longbridge App, desktop client, or Longbridge CLI. The standalone `navi` CLI is primarily a developer tool and does not replace the Longbridge product experience.
## Longbridge App and Desktop
Use Navi inside the Longbridge App or desktop client when working interactively with charts. The Navi runtime is integrated into the product, so there is no separate Navi CLI to install.
[Download Longbridge](https://longbridge.com/download)
## Longbridge CLI
Use the Longbridge CLI for command-line workflows backed by Longbridge services and market data.
Install it by following the [Longbridge CLI installation guide](https://open.longbridge.com/docs/cli/install), then authenticate:
```bash
longbridge auth login
```
Continue to [Quick Start](/docs/quick-start) to write a script and run it with Longbridge market data. See the [`longbridge quant run` documentation](https://open.longbridge.com/docs/cli/quant) for all command options.
## Navi CLI for Development
Install the standalone `navi` CLI when developing or debugging `.nv` files locally, or when validating scripts in CI.
macOS or Linux:
```bash
curl -fsSL https://navi-lang.org/install.sh | sh
```
Windows PowerShell:
```powershell
irm https://navi-lang.org/install.ps1 | iex
```
Verify the installation:
```bash
navi --version
```
The standalone CLI contains no market data, but it does run scripts: `navi check` and `navi fmt` verify compilation and formatting, and `navi run` executes a script against data you supply on stdin as NDJSON, writing each bar's plot values and any alerts to stdout. `navi check` and `navi fmt` accept files, directories, and glob patterns, so a whole project can be validated in one command. Run `navi update` to upgrade the binary in place.
## VS Code Extension
The Navi VS Code extension adds syntax highlighting, diagnostics, completion, hover, go-to-definition, and formatting for `.nv` files. It bundles a WebAssembly language server, so it works with no separate install — including in browser VS Code (vscode.dev / github.dev).
[Download the VS Code extension (.vsix)](/navi-vscode.vsix)
Install it from the command line:
```bash
code --install-extension navi-vscode.vsix
```
Or in VS Code: open the Extensions view, use the `···` menu → **Install from VSIX…**, and select the downloaded file.
To use a native `navi-lsp` binary instead of the bundled WebAssembly server, set `navi.server.mode` to `native` and point `navi.server.path` at the binary.
## Next Steps
- [Quick Start](/docs/quick-start) — write and validate your first Navi script
- [Language Basics](/docs/language-basics) — learn Navi syntax and naming conventions
- [AI Assistant](/docs/ai) — install the Navi authoring skill
---
# language-basics
# Language Basics
Every Navi script begins with a declaration statement: `indicator()`, `strategy()`, or `library()`.
## Script Structure
```navi
indicator("My Indicator");
// Your code here
plot(close);
```
Navi uses **brace blocks** `{ }` and **semicolons** `;` to terminate statements. Newlines are insignificant — you can split or join lines freely.
## Comments
```navi
// Single-line comment
let a: float = 10; // End-of-line comment
```
There are no multi-line comments. Special comments starting with `//@` are documentation tags: `//@function`, `//@param`, `//@returns`, `//@type`, `//@enum`, `//@field`, `//@variable`, `//@description`.
## Statements
Every statement ends with `;`. Newlines are insignificant — multiple statements can appear on one line, and a single statement can span multiple lines:
```navi
let a = 1; let b = 2; let c = a + b; // multiple on one line
let result = long_variable_name // split across lines
+ another_long_variable
- some_other_value;
```
Statements that end with a closing brace `}` (functions, if/for/while, etc.) do not take a trailing `;`.
## Naming Conventions
Use consistent names in Navi source code:
- Variables, parameters, functions, methods, and properties use `snake_case`: `fast_length`, `long_signal`, `calculate_average`.
- Structs, enums, newtypes, and enum variants use `PascalCase`: `TradeState`, `Direction.Long`.
- Compile-time constants use `SCREAMING_SNAKE_CASE`: `MAX_LOOKBACK`.
- New `.nv` filenames use `snake_case`: `relative_strength_index.nv`.
The files under `example/indicators/` follow this filename convention.
## Basic Types
### Primitive Types
| Type | Description | Examples |
|---|---|---|
| `int` | Integer | `42`, `-123`, `+5` |
| `float` | Floating-point number | `3.14`, `.5`, `3.`, `1e-3` |
| `bool` | Boolean | `true`, `false` |
| `String` | Text | `"hello"`, `'world'` |
| `color` | RGBA color | `#FF0000`, `#FF000080` |
| `na` | Missing/undefined value | `na` |
### `int` and `float`
```navi
let a = 42;
let b = -123;
let d = 3.14;
let e = .14; // leading dot
let f = 3.; // trailing dot
let g = 314e-2; // 3.14
```
### `String`
Strings can use single or double quotes with identical semantics:
```navi
let a = "Hello, World!";
let b = 'Hello, World!';
let full = "Hello, " + "World!"; // concatenation with +
```
Supported escape sequences:
| Escape | Meaning |
|---|---|
| `\\` | Backslash |
| `\n` | Newline |
| `\r` | Carriage return |
| `\t` | Tab |
| `\"` or `""` | Double quote (in double-quoted strings) |
| `\'` or `''` | Single quote (in single-quoted strings) |
### Locale-aware strings
Use `@locale { ... }` to provide per-locale translations inline. The runtime
selects the translation matching the current locale (set by the host
application), with language-prefix fallback (`zh-CN` → `zh`) and a mandatory
`default` fallback:
```navi
let title = @locale {
default: "Price",
"zh-CN": "价格",
"ja": "価格",
};
plot(close, title = @locale { default: "MA", "zh-CN": "均线" });
```
The result is `const String` — compatible everywhere a plain string literal is
accepted.
### `color`
Color literals use hex notation with `#`:
- `#RRGGBB` — 6 hex digits, fully opaque
- `#RRGGBBAA` — 8 hex digits, explicit alpha
```navi
let red = #FF0000; // fully opaque red
let semiRed = #FF000080; // semi-transparent red
```
Named color constants: `color.RED`, `color.BLUE`, `color.GREEN`, etc. Use `color.new()` for custom transparency.
### `na`
`na` represents a missing or undefined value. It is compatible with any type but requires an explicit type annotation when used alone:
```navi
let a: float = na; // OK
let b = na; // ERROR: cannot infer type
if na(myValue) {
// handle missing value
}
```
## Operators
### Arithmetic
```navi
let a = 10 + 3; // 13
let b = 10 - 3; // 7
let c = 10 * 3; // 30
let d = 10 / 3; // 3.333...
let e = 10 % 3; // 1
```
### Comparison
```navi
close > open; // greater than
close < open; // less than
close >= 100; // greater or equal
close <= 100; // less or equal
close == open; // equal
close != open; // not equal
```
### Logical
```navi
a and b; // AND
a or b; // OR
not a; // NOT
```
### Ternary
```navi
let col = close > open ? color.GREEN : color.RED;
```
## Next Steps
- [Variables & Qualifiers](/docs/types-and-variables) — type qualifiers, var/varip, na handling
- [History Reference](/docs/history-reference) — accessing past bar values with `[]`
- [Collections](/docs/collections) — array, map, matrix
- [Control Structures](/docs/control-structures) — if, for, while, switch
- [Functions & Methods](/docs/functions-and-methods) — defining and calling functions
---
# quick-start
# Quick Start
Before starting, [choose and set up how you want to use Navi](/docs/install). This guide uses the Longbridge CLI to run scripts with market data and the optional standalone `navi` CLI for local development checks.
## Write Your First Indicator
Create `sma.nv`:
```navi
indicator("SMA", overlay: true);
let len = input.int(14, "Length", minval: 1);
plot(ta.sma(close, len), "SMA", color: Color.BLUE);
```
The blue line is the 14-bar simple moving average produced by the indicator over the AAPL daily candles.
## Check Locally (Optional)
If you installed the standalone `navi` CLI for development, validate the script before running it:
```bash
navi check sma.nv
navi fmt --check sma.nv
```
`check` validates syntax, types, compilation, and imports. `fmt --check` reports whether the source is canonically formatted without touching it; `navi fmt` rewrites it in place.
Both commands take any number of paths, and each one can be a file, a directory, or a glob pattern, so a whole project is validated in a single command:
```bash
navi check "**/*.nv"
navi fmt .
```
The standalone CLI carries no market data and does not execute scripts. To see an indicator run against candles, use the Longbridge CLI below, or open it in the [Playground](/playground).
## Run with Longbridge
Run the indicator against historical market data with the Longbridge CLI:
```bash
cat sma.nv | longbridge quant run AAPL.US \
--start 2024-01-01 \
--end 2024-12-31
```
See the [`longbridge quant run` documentation](https://open.longbridge.com/docs/cli/quant) for data periods, inputs, output formats, and backtesting options. You can also use the same script interactively in the Longbridge App or desktop client.
## Write a Strategy
```navi
strategy("MA Cross", overlay: true);
let fast = ta.ema(close, input.int(10, "Fast"));
let slow = ta.ema(close, input.int(20, "Slow"));
if ta.cross_over(fast, slow) {
strategy.close("Short");
strategy.entry("Long", Direction.Long);
}
if ta.cross_under(fast, slow) {
strategy.close("Long");
strategy.entry("Short", Direction.Short);
}
plot(fast, "Fast EMA");
plot(slow, "Slow EMA");
```
```bash
navi check ma_cross.nv
navi fmt --check ma_cross.nv
```
## PineScript Compatibility
Navi is compatible with PineScript v6 syntax, so an existing `.pine` script can run on the Longbridge platform without being rewritten first. The standalone `navi` CLI is Navi-only and accepts `.nv` files.
### Converting to Navi
Both examples calculate Bollinger Bands. PineScript fills the envelope, while the compact Navi version uses a trend-colored basis and simple range boundaries.
```pine
// @version=6
indicator("Bollinger Bands", overlay=true)
length = input.int(20, "Length")
mult = input.float(2.0, "Multiplier")
[basis, upper, lower] = ta.bb(close, length, mult)
plot(basis, "Basis", color.blue)
upper_plot = plot(upper, "Upper", color.red)
lower_plot = plot(lower, "Lower", color.green)
fill(upper_plot, lower_plot, color.new(color.blue, 90))
```
```navi
indicator("Bollinger Range", overlay: true);
let price_source = input.source(close, "Source");
let period = input.int(20, "Period", minval: 1);
let deviation = input.float(2.0, "Deviation", minval: 0.1);
let (middle, upper_band, lower_band) = ta.bb(price_source, period, deviation);
let middle_color = middle > middle[1] ? Color.GREEN : Color.RED;
plot(middle, "Trend Basis", color: middle_color, line_width: 2);
plot(upper_band, "Upper Range", color: Color.BLUE);
plot(lower_band, "Lower Range", color: Color.BLUE);
```
## Next Steps
- [Language Basics](/docs/language-basics)
- [Standard Library](/api/stdlib/)
---
# request-security
# Cross-Symbol & Multi-Timeframe
`request.security()` evaluates an expression in the context of a different
symbol and/or timeframe, and returns the result aligned to the current chart
bar. It is the primary way to access multi-timeframe (MTF) data and data from
other instruments in Navi.
## Basic Syntax
```navi
request.security(symbol, timeframe, expression, gaps, lookahead, ignore_invalid_symbol, currency, calc_bars_count)
```
| Parameter | Type | Description |
|---|---|---|
| `symbol` | `String` | Symbol identifier, e.g. `"AAPL.US"` or `syminfo.tickerid` |
| `timeframe` | `String` | Timeframe string, e.g. `"D"`, `"W"`, `"60"` |
| `expression` | any series | Expression evaluated on the requested symbol/timeframe |
| `gaps` | `BarmergeGaps` | `BarmergeGaps.Off` (default): carry last value forward; `BarmergeGaps.On`: emit `na` between confirmations |
| `lookahead` | `BarmergeLookahead` | `BarmergeLookahead.Off` (default) or `BarmergeLookahead.On` |
| `ignore_invalid_symbol` | `bool` | If `true`, return `na` instead of error for unknown symbols |
| `currency` | `String` | Quote the requested series in this currency instead of the symbol's own. Served by the data provider; `syminfo.currency` inside `expression` reports it |
| `calc_bars_count` | `int` | Optional positive limit for how much recent request history is loaded |
## Simple Examples
### Higher timeframe close
```navi
indicator("Weekly Close on Daily Chart", overlay: true);
let weekly_close = request.security(syminfo.tickerid, "W", close);
plot(weekly_close, "Weekly Close", color: color.BLUE);
```
### Another symbol
```navi
indicator("SPY on AAPL chart", overlay: false);
let spy_close = request.security("SPY.US", "D", close);
plot(spy_close);
```
### Higher timeframe indicator
```navi
indicator("Weekly RSI");
let weekly_rsi = request.security(syminfo.tickerid, "W", ta.rsi(close, 14));
plot(weekly_rsi);
hline(70);
hline(30);
```
## Timeframe Strings
| String | Meaning |
|---|---|
| `"1"`, `"5"`, `"15"`, `"60"` | Minutes |
| `"D"` | Daily |
| `"W"` | Weekly |
| `"M"` | Monthly |
| `"3M"`, `"6M"` | Multi-month |
Use `timeframe.period` to reference the chart's own timeframe.
## Warm-up
The requested expression is a series in its own right: it is evaluated bar by
bar on the requested timeframe, with its own history. So `ta.rsi(close, 14)` on
a weekly request needs fourteen *weekly* bars before it means anything — and
those bars are normally older than the chart's first bar.
The engine asks for them. A weekly stream is requested as "cover the chart's
first bar onward, and reach further back if it helps", together with how deep
the expression reads, so a provider that honours it hands back the earlier
weekly bars and the plot has a settled value from the chart's first bar.
Whether that happens is up to your data source. A provider that sends only bars
at or after the chart's first bar is still correct — the expression simply warms
up on its own, and the plot opens `na` for as long as it reads back. On a daily
chart, a weekly `ta.sma(close, 10)` with no warm-up is about ten weeks of `na`
before the first value. If you see that, the stream is being trimmed at the
chart boundary.
The built-in providers, the playground and `navi-chart` all reach back.
## `calc_bars_count`
Use `calc_bars_count` when a request only needs a short recent window.
- A positive value asks the provider for at most that many recent bars for the requested stream.
- `na` leaves the stream uncapped: it is anchored on the chart and the provider
may reach back for warm-up, as above.
`calc_bars_count` is a cap, so it opts out of the warm-up above — the request is
"the last N bars" and nothing older. Set it low and an indicator inside the
expression may not have enough bars to settle.
```navi
let recent_weekly = request.security(syminfo.tickerid, "W", close, calc_bars_count: 2);
```
## Gaps
When the requested timeframe is higher than the chart timeframe, a new higher-TF
bar closes less frequently than the chart advances.
- **`BarmergeGaps.Off`** (default): the last known value is carried forward — the series
has no `na` values between higher-TF bar closes.
- **`BarmergeGaps.On`**: a `na` is emitted for every chart bar where the higher-TF bar
has not yet closed.
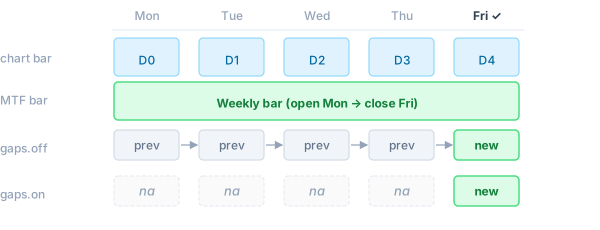
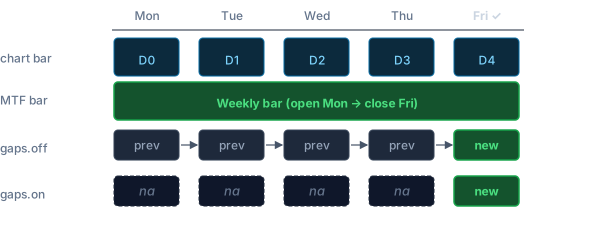 ```navi
// Off (default): weekly_close carries forward — always defined
let weekly_close = request.security(syminfo.tickerid, "W", close);
// On: na on every day except when the weekly bar closes
let weekly_close_gaps = request.security(syminfo.tickerid, "W", close, gaps: BarmergeGaps.On);
```
## Lookahead
`BarmergeLookahead.On` makes the expression see the **final value** of the higher-TF bar
from the very first chart bar within that period, rather than the still-forming
value. This can introduce future leak into historical bars — only use it when
intentional.
```navi
// Off (default): weekly_close carries forward — always defined
let weekly_close = request.security(syminfo.tickerid, "W", close);
// On: na on every day except when the weekly bar closes
let weekly_close_gaps = request.security(syminfo.tickerid, "W", close, gaps: BarmergeGaps.On);
```
## Lookahead
`BarmergeLookahead.On` makes the expression see the **final value** of the higher-TF bar
from the very first chart bar within that period, rather than the still-forming
value. This can introduce future leak into historical bars — only use it when
intentional.
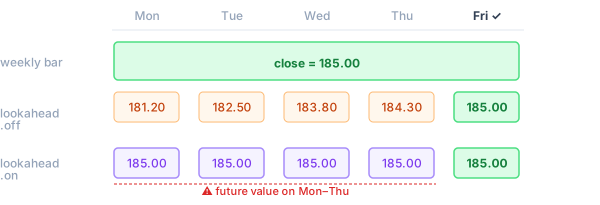
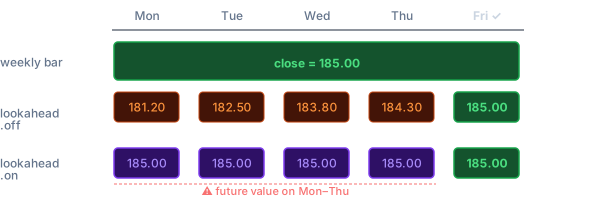 ```navi
// Default: sees the forming weekly close (updates throughout the week)
let weekly_open = request.security(syminfo.tickerid, "W", open);
// With lookahead: sees the confirmed weekly open immediately on Monday
let weekly_open_confirmed = request.security(syminfo.tickerid, "W", open, lookahead: BarmergeLookahead.On);
```
## `var` and `varip` Variables
`var` and `varip` variables cannot be declared inside the `expression` argument.
To accumulate state across bars on the **requested** timeframe, declare the
variable at the top level of the script. The sub-instance runs the full program
body on the requested symbol/timeframe, so top-level `var` state is maintained
per call site independently of the main chart:
```navi
indicator("Cumulative Volume (Weekly)");
// Declared at top level — the sub-instance accumulates this on weekly bars
var cum: float = 0.0;
cum += volume;
let weekly_cum_vol = request.security(syminfo.tickerid, "W", cum);
plot(weekly_cum_vol);
```
Each `request.security` call site has an isolated sub-instance — its `var`
state is independent of the main script and of other `request.security` calls.
## Tuples
An expression can return multiple values as a tuple:
```navi
indicator("Weekly OHLC");
let (w_open, w_high, w_low, w_close) =
request.security(syminfo.tickerid, "W", (open, high, low, close));
plot_candle(w_open, w_high, w_low, w_close);
```
## `ignore_invalid_symbol`
Use this flag when the symbol might not exist in the data provider:
```navi
let price = request.security("SOME.US", "D", close, ignore_invalid_symbol: true);
// price is na if the symbol is not recognised; no runtime error is raised
```
Without this flag, an unrecognised symbol raises a runtime error and halts
execution.
## `request.security_lower_tf`
For lower timeframes, use `request.security_lower_tf`. It returns an
`Array` containing every sub-bar value within the current chart bar,
in ascending order:
```navi
// Default: sees the forming weekly close (updates throughout the week)
let weekly_open = request.security(syminfo.tickerid, "W", open);
// With lookahead: sees the confirmed weekly open immediately on Monday
let weekly_open_confirmed = request.security(syminfo.tickerid, "W", open, lookahead: BarmergeLookahead.On);
```
## `var` and `varip` Variables
`var` and `varip` variables cannot be declared inside the `expression` argument.
To accumulate state across bars on the **requested** timeframe, declare the
variable at the top level of the script. The sub-instance runs the full program
body on the requested symbol/timeframe, so top-level `var` state is maintained
per call site independently of the main chart:
```navi
indicator("Cumulative Volume (Weekly)");
// Declared at top level — the sub-instance accumulates this on weekly bars
var cum: float = 0.0;
cum += volume;
let weekly_cum_vol = request.security(syminfo.tickerid, "W", cum);
plot(weekly_cum_vol);
```
Each `request.security` call site has an isolated sub-instance — its `var`
state is independent of the main script and of other `request.security` calls.
## Tuples
An expression can return multiple values as a tuple:
```navi
indicator("Weekly OHLC");
let (w_open, w_high, w_low, w_close) =
request.security(syminfo.tickerid, "W", (open, high, low, close));
plot_candle(w_open, w_high, w_low, w_close);
```
## `ignore_invalid_symbol`
Use this flag when the symbol might not exist in the data provider:
```navi
let price = request.security("SOME.US", "D", close, ignore_invalid_symbol: true);
// price is na if the symbol is not recognised; no runtime error is raised
```
Without this flag, an unrecognised symbol raises a runtime error and halts
execution.
## `request.security_lower_tf`
For lower timeframes, use `request.security_lower_tf`. It returns an
`Array` containing every sub-bar value within the current chart bar,
in ascending order:
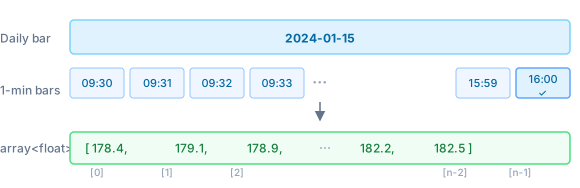
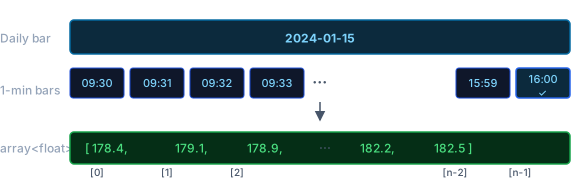 ```navi
indicator("Intraday highs on Daily chart");
// Returns an array of all 1-minute highs within each daily bar
let minute_highs = request.security_lower_tf(syminfo.tickerid, "1", high);
// Highest 1-minute high within the current daily bar
let intraday_high = minute_highs.max();
plot(intraday_high);
```
The array is empty (`minute_highs.size() == 0`) for bars where no sub-bars are
available.
## Ticker Expressions
A ticker expression is a string that combines multiple symbols using arithmetic
operators. Navi decomposes it into individual `DataProvider` requests, evaluates
the expression per bar, and returns the result as a single series.
### Supported operators
| Operator | Example | Result |
|---|---|---|
| `*` | `"AAPL*2"` | symbol value × scalar |
| `/` | `"AAPL/SPY"` | ratio between two symbols |
| `+` | `"AAPL+MSFT"` | sum of two symbols |
| `-` | `"AAPL-MSFT"` | difference of two symbols |
Operands can be symbol strings (`"TICKER.MARKET"`) or numeric literals.
Standard operator precedence applies; use parentheses if needed.
### Examples
**Weighted blend (50/50 portfolio)**
```navi
let blend = request.security("AAPL.US*0.5+SPY.US*0.5", "D", close);
```
**Relative performance (ratio)**
```navi
// AAPL price relative to SPY — how many SPY shares does one AAPL buy?
let ratio = request.security("AAPL.US/SPY.US", "D", close);
plot(ratio);
```
**Spread (difference)**
```navi
// Gold/Silver spread
let spread = request.security("GC1!.US/SI1!.US", "D", close);
plot(spread);
```
**Multi-symbol index**
```navi
// Equal-weight average of four tech stocks
let tech = request.security(
"AAPL.US*0.25+MSFT.US*0.25+GOOGL.US*0.25+AMZN.US*0.25",
"D",
close
);
plot(tech);
```
### How it works
For an expression like `"AAPL*0.5+SPY*0.5"`, Navi:
1. Extracts each symbol (`AAPL`, `SPY`) and fetches their candlestick data via `DataProvider`.
2. On each bar, evaluates the arithmetic expression using the requested `expression` field (e.g. `close`) from each symbol's sub-instance.
3. Returns the computed scalar result aligned to the chart bar.
Each symbol in the expression is subject to the same `max_security_calls` limit as a regular `request.security` call.
## Limitations
- **Nesting**: an expression inside `request.security` may itself call
`request.security`, to any depth. There is no separate depth limit; what
bounds nesting is the child limit below, since every level builds at least
one child.
- **Circular expressions are refused**: if a chain of requests comes back to a
call site it has already passed through, nothing would ever end it. The run
stops with an error naming the cycle instead of exhausting memory.
- **Child limit**: `ExecutionLimits::max_security_calls` (default 40) caps how
many children one run may build. A child is a whole sub-instance — its own
state, series buffers and `bar_index` — and **one call site can cost more
than one**:
- naming a different `symbol` or `timeframe` on a later bar opens a child for
that series too, and keeps the earlier one in case the call site returns to
it;
- an expression that reads another request's result makes that request part
of what this child evaluates, against its own series, so a chain of four
requests reading each other costs ten children rather than four.
Call sites naming the same `(symbol, timeframe)` share the data that is
fetched but not the count, so four fields of one symbol are four.
---
# types-and-variables
# Variables & Qualifiers
## Variable Declaration
Variables can be declared with explicit or inferred types:
```navi
// Type inferred
let a = 10; // inferred as int
let name = "AAPL"; // inferred as String
// Explicit type
let b: float = 3.14;
let label: String = "Buy";
let flag: bool = true;
```
If the type cannot be inferred, an explicit annotation is required:
```navi
let a = na; // ERROR: cannot infer variable type
let a: float = na; // OK
```
## Reassignment
Use `=` to reassign a variable. Compound assignment operators are also supported:
```navi
let a = 10;
a = 20; // Reassignment
a += 5; // a = a + 5
a -= 1; // a = a - 1
a *= 2; // a = a * 2
a /= 3; // a = a / 3
a %= 4; // a = a % 4
```
## Type Qualifiers
Navi has four type qualifiers that describe when a value is known, from most restrictive to least:
| Qualifier | Meaning |
|---|---|
| `const` | Known at compile time, never changes |
| `input` | Known at script startup (e.g., user inputs) |
| `simple` | Known on bar 0, not derived from the current bar's data |
| `series` | Derived from the current bar — a new value on every bar |
```navi
let a: const int = 2;
let b: input int = 10;
let c: simple int = a + b;
let d: series float = close;
```
The qualifier hierarchy flows: `const` -> `input` -> `simple` -> `series`. A value can be auto-promoted up this hierarchy but not demoted.
Only `const` and `input` hold the same value for a whole run. `simple` says the value does not come from bar data — not that it never changes, since a variable holding one can still be reassigned on each bar:
```navi
fn takes_simple(x: simple int): int { x; }
var n = 0;
n = n + 1; // `n` is `simple int`, and counts 1, 2, 3, …
plot(float(takes_simple(n)));
```
## `var` — Initialize Once, Persist Across Bars
Without a declaration mode, variables are re-initialized on **every script execution** (every bar, every tick). The `var` keyword changes this — the variable is initialized **only once** on the first bar, and retains its last assigned value on all subsequent bars:
```navi
indicator("Green Bars Count");
var count = 0;
let isGreen = close >= open;
if isGreen {
count = count + 1;
}
plot(count);
```
Without `var`, `count` would reset to `0` on every bar, so the plot would only show `0` or `1`. With `var`, the value accumulates across bars.
### `var` inside `if` blocks
`var` can be used inside `if` blocks. The variable is initialized on the **first execution that enters the block**:
```navi
var a = close;
var b = 0.0;
if close > open {
var x = close; // initialized once when this branch first executes
b = x;
}
```
### `var` with collections
`var` works with all types including arrays and objects. A `var` array persists and can grow across bars:
```navi
var a = Array.new(0);
a.push(close); // array grows by 1 element on each bar
```
### Real-time behavior of `var`
On historical bars, `var` and non-`var` behave identically because the script runs exactly once per bar. The difference is visible on **real-time bars**: without `var`, the variable resets on each tick; with `var`, it retains its value across ticks but is subject to **rollback** when the bar closes (the value reverts to what it was at the last confirmed bar, then re-executes once for the new confirmed bar).
## `varip` — Persist Without Rollback
`varip` (var intrabar persist) is similar to `var` — initialized only once. The key difference is that `varip` variables are **not subject to rollback** on real-time bars. They retain their values across all executions, including multiple ticks within the same unconfirmed bar:
```navi
indicator("varip demo");
varip updateCount: int = na;
if barstate.is_new {
updateCount = 1;
} else {
updateCount = updateCount + 1;
}
plot(updateCount, style: PlotStyle.Circles);
```
This is useful for tracking tick-level data. On historical bars, `varip` behaves identically to `var`.
### `varip` on type fields
`varip` can be used on individual type fields to make them persist across intrabar updates while other fields still roll back:
```navi
struct Counter {
bars: int = 0,
varip ticks: int = 0,
}
var counter: Counter = Counter.new();
counter.bars += 1; // subject to rollback on unconfirmed bars
counter.ticks += 1; // NOT subject to rollback
```
### Comparison Table
| Behavior | No keyword | `var` | `varip` |
|---|---|---|---|
| Initialization | Every execution | Once (first bar) | Once (first bar) |
| Historical bars | Re-init each bar | Persists | Persists |
| Real-time ticks | Re-init each tick | Persists (with rollback) | Persists (no rollback) |
## Tuple Destructuring
Functions that return tuples can be destructured with `(...)` syntax:
```navi
let (median, upperBand, lowerBand) = ta.bb(close, 20, 2.0);
plot(median);
plot(upperBand);
plot(lowerBand);
```
## Discard (`_`)
Use `_` to discard unwanted values. It can be used multiple times:
```navi
let (_, upper, _) = ta.bb(close, 20, 2.0);
let _ = someFunction(); // Discard return value
let _ = anotherFunction();
```
## `na` — Missing Values
`na` represents a missing or undefined value. Many functions return `na` when there isn't enough data:
```navi
let sma5 = ta.sma(close, 5); // na for the first 4 bars
// Check for na with na()
if not na(sma5) {
label.new(bar_index, sma5, String.from(sma5));
}
```
Use `nz()` to replace `na` with a default:
```navi
let value = nz(ta.sma(close, 5), 0.0); // Replace na with 0
```
Use `fixnan()` to replace `na` with the last non-na value:
```navi
let value = fixnan(ta.sma(close, 5));
```
## Next Steps
- [Control Structures](/docs/control-structures) — if, for, while, switch
- [Functions & Methods](/docs/functions-and-methods) — defining and calling functions
---
# skill
## Install
Add the `navi` skill to your AI coding agent with the [Skills CLI](https://github.com/vercel-labs/skills):
```bash
npx skills add longbridge/navi
```
## Update
Pull the latest version of the skill whenever the docs change:
```bash
npx skills update navi
```
See the [AI Assistant guide](/docs/ai) for agent-specific options and usage.
---
# SKILL
Write valid Navi code for chart indicators, strategies, and reusable libraries. Keep every answer focused on Navi authoring: syntax, execution semantics, standard-library calls, and practical script patterns.
## Source of Truth
Navi's standard library and, occasionally, its syntax evolve. This skill captures the stable authoring model — it deliberately does **not** reproduce the full API. Treat **navi-lang.org** as authoritative and verify concrete API details there instead of trusting memory or any list embedded in this skill.
- Full documentation in one file (language guide + complete stdlib API):
- Documentation index, per topic — fetch a single page on demand:
- Any single doc page as raw markdown: use the exact URL listed in `llms.txt`, e.g.
Before using any concrete API — a function name, signature, enum variant, or method name — confirm it against the source above. When unsure, fetch `llms-full.txt` (or the specific page) rather than guessing.
Never construct a documentation URL from a symbol name. Fetch `llms.txt` first and copy an exact link from it. In particular:
- Guide pages live under `/docs/`, not `/ai/` or `/guide/`.
- Namespace/module pages use `/api/stdlib//index.md`.
- Prelude types and enums use `/api/stdlib/prelude/.md`, such as `Table.md` and `PlotDisplay.md`; they do not have nested `index.md` pages.
- Free prelude functions such as `plot`, `bg_color`, `na`, and `nz` are sections of `/api/stdlib/prelude/index.md`; they do not have one page per function.
- If a guessed URL returns 404, stop guessing paths and return to `llms.txt`.
## Reference Map
Load only the reference needed for the task:
| Read this | When you need to... |
| --- | --- |
| [references/syntax.md](references/syntax.md) | Check Navi source syntax: statements, blocks, declarations, types, collections, functions, methods, structs, enums, imports, and exports. |
| [references/execution-model.md](references/execution-model.md) | Reason about bar-by-bar execution, series values, qualifiers, `var`/`varip`, rollback, `na`, history references, and repainting. |
| [references/stdlib.md](references/stdlib.md) | Learn the stdlib naming rules and how to look up exact API names, signatures, and enum variants on navi-lang.org. |
| [references/patterns.md](references/patterns.md) | Start from complete indicator/strategy/library templates or reuse idioms for warmup guards, crosses, state, arrays, MTF data, divergence, debugging, and output polish. |
| [references/cli.md](references/cli.md) | Install the `navi` CLI, or run a script to see what it computes: `navi check`/`fmt`/`run`, the stdin NDJSON protocol, and driver patterns. |
## Authoring Workflow
1. Identify the script kind: `indicator()` for visual studies, `strategy()` for orders/backtests, or `library()` for exported helpers.
2. Put configuration first with `input.*()` calls. Prefer typed inputs (`input.int`, `input.float`, `input.source`, `input.string`, `input.bool`) and use stable titles.
3. Model time correctly. Treat `close`, `high`, `ta.*` outputs, conditions, and plots as per-bar `series` values. Use `x[1]` for prior bars.
4. Use `let` for per-bar calculations, `var` for state that must persist across bars, and `varip` only for intentional intrabar state.
5. Guard warmup and missing values with `na()`, `nz()`, or `fixnan()`; never assume `na` is zero.
6. Confirm standard-library API names and signatures against navi-lang.org (`llms.txt`, then its exact page link) before using them; do not rely on remembered lists or synthesize URLs. As a rule, Navi built-in functions are snake_case (e.g. `ta.cross_over`, `bg_color`) and types/enums are PascalCase (e.g. `Direction.Long`).
7. Make outputs deterministic and readable: stable plot order, clear titles, explicit colors, and `na` or `PlotDisplay.NONE` when hiding output.
8. When returning code, return complete `.nv` source unless the user asked for only a fragment.
## Naming Style
Follow these Navi naming conventions consistently:
- Use `snake_case` for variables, parameters, functions, methods, and properties: `fast_length`, `long_signal`, `ema_of`.
- Use `PascalCase` for structs, enums, newtypes, and enum variants: `TradeState`, `Direction.Long`.
- Use `SCREAMING_SNAKE_CASE` for compile-time constants: `MAX_LOOKBACK`.
- Use `snake_case.nv` for new filenames when repository conventions allow it.
## CLI Validation
Validate every complete `.nv` file you create or modify with the `navi` CLI. Read
[references/cli.md](references/cli.md) before the first CLI call in a session — installation,
every flag, and the `navi run` wire protocol are there.
1. `navi check path/to/script.nv` — the completion gate: syntax, types, compilation, imports.
2. `navi fmt path/to/script.nv` — canonical formatting. Independent of compilation, so run both.
3. `navi run path/to/script.nv`, with market data on stdin, when the task turns on
what the script computes rather than whether it compiles.
4. Treat every non-zero exit status as a failed validation. Fix the script and repeat until
every command exits successfully; report the commands run and any validation that could not
be completed.
Pass several paths in one call rather than one call per file — `check` and `fmt` both accept
files, directories, and quoted glob patterns.
`navi run` executes the script against data you provide; the CLI bundles none and downloads
none. Its stdout is pure NDJSON (plot values, alerts, and the script's own `log.*()`) and its
stderr is human-readable diagnostics — capture them separately, **never `2>&1`**, or the JSON
stream is corrupted.
Do not claim that a code fragment was CLI-validated unless it was placed in a complete `.nv`
script and the command succeeded.
## Playground Preview Links
When a user wants an online preview, encode the complete UTF-8 source as unpadded Base64URL and append it as the `code` query parameter:
```text
https://navi-lang.org/playground?code=
```
Base64URL uses `-` and `_` instead of `+` and `/`, with trailing `=` padding removed. Generate this link only after CLI validation, and keep the full script in the response because very large scripts may exceed browser or chat URL limits.
## Navi Essentials
- Every script begins with `indicator(...)`, `strategy(...)`, or `library(...)`.
- Statements end with `;`. Block declarations such as `fn`, `if`, `for`, `while`, `switch`, `struct`, and `enum` end with `}` when used standalone.
- Type annotations use `name: type`, with qualifiers before the type: `let ma: series float = close;`.
- Collections are PascalCase: `Array`, `Map`, `Matrix`. Construct with `Array.new()`, `Map.new()`, and `Matrix.new()`.
- Tuples use parentheses and must be immediately destructured: `let (basis, upper, lower) = ta.bb(close, 20, 2.0);`.
- Navi has no `return` keyword. A function or expression block yields its last statement.
- Use PascalCase enums: `Shape.TriangleUp`, `Location.BelowBar`, `PlotStyle.Histogram`, `Direction.Long`, `BarmergeLookahead.Off`.
## Starter Templates
Minimal indicator:
```navi
indicator("My Indicator", overlay: true);
let len = input.int(14, "Length", minval: 1);
let src = input.source(close, "Source");
let ma = ta.sma(src, len);
plot(ma, "SMA", color: Color.ORANGE);
```
Minimal strategy:
```navi
strategy("MA Cross", overlay: true);
let fast_len = input.int(10, "Fast Length", minval: 1);
let slow_len = input.int(20, "Slow Length", minval: 1);
let fast = ta.ema(close, fast_len);
let slow = ta.ema(close, slow_len);
let long_signal = ta.cross_over(fast, slow);
let short_signal = ta.cross_under(fast, slow);
if long_signal {
strategy.entry("Long", Direction.Long);
}
if short_signal {
strategy.entry("Short", Direction.Short);
}
plot(fast, "Fast EMA", color: Color.GREEN);
plot(slow, "Slow EMA", color: Color.RED);
```
Reusable library:
```navi
// @description Shared moving-average helpers.
library("MaLib");
// @function Calculates an exponential moving average.
// @param src Source series.
// @param length EMA length.
// @returns EMA series.
// @see func:ta.sma
// @see func:ta.wma
export fn ema_of(src: series float, length: simple int): series float {
ta.ema(src, length);
}
```
---
# cli
# CLI Reference
The standalone `navi` CLI is a compiler, a formatter, and a runner. It contains no market
data and downloads none, but `navi run` does execute scripts against data you supply on
stdin. Its role in an authoring session is to prove three things: the script compiles, it
is canonically formatted, and it computes what you expect.
Use `navi --help` for current, detailed behavior; `-h` only prints a summary.
## Installing
Check first with `command -v navi` (`Get-Command navi` on Windows). If it is missing,
install it when local tool installation is in scope; otherwise give the command to the user.
macOS or Linux:
```bash
curl -fsSL https://navi-lang.org/install.sh | sh
```
Windows PowerShell:
```powershell
irm https://navi-lang.org/install.ps1 | iex
```
Both scripts download a prebuilt binary — no toolchain, no compilation from source.
## `navi check` — the completion gate
```bash
navi check path/to/script.nv
```
Checks syntax, types, compilation, and imports. This is the default gate: a script is not
finished until it passes.
## `navi fmt` — canonical formatting
```bash
navi fmt path/to/script.nv # rewrite in place
navi fmt --check path/to/script.nv # report differences, write nothing
```
Formatting is independent of compilation, so run both commands.
## Validating several files at once
Both commands take any number of paths, and each may be a file, a directory, or a glob —
prefer one call over one call per file:
```bash
navi check "src/**/*.nv"
navi fmt src
```
Quote glob patterns so `navi` expands them itself. Matching no files is an error, so a
mistyped pattern fails rather than silently passing.
## `navi run` — checking what a script computes
`navi run` executes the script against market data you provide on stdin as NDJSON, and
writes each bar's `plot()` values, alerts, `log.*()` output and strategy events to stdout
as NDJSON. It is the first
choice for confirming behavior. Reach for `longbridge quant run`, a Longbridge MCP server,
or the Playground only when the task needs real market data rather than data you supply.
### Without a driver
Send one line carrying the whole dataset and read the output directly. Enough for "run this
over these bars and show me the values", and — piped through `jq` — for an alert-only check:
```bash
echo '{"type":"bar","data":[{"time":1700006400000,"close":103},{"time":1700092800000,"close":107}]}' \
| navi run script.nv
```
`data` accepts a single object or an array, and an array implies the history boundary. A
`.json` file of candles can be piped straight in:
```bash
jq -c '{type:"bar",data:.}' bars.json | navi run script.nv
```
### With a driver
Write a small program that reads stdout, answers each `request` line by its `id`, and
reports only what you need. Required for any script using `request.security`,
`request.dividends`, or `request.data`, and for continuous monitoring.
```python
import json, subprocess
BARS = [{"time": 1700006400000 + i * 86400000, "close": 100 + i} for i in range(3)]
p = subprocess.Popen(["navi", "run", "script.nv"],
stdin=subprocess.PIPE, stdout=subprocess.PIPE, text=True)
def send(obj):
p.stdin.write(json.dumps(obj) + "\n")
p.stdin.flush()
rows, alerts, fills = [], [], []
while True:
# An explicit readline loop: `for line in p.stdout` reads ahead and can
# block against a process that is waiting for your answer.
line = p.stdout.readline()
if not line:
break
msg = json.loads(line)
kind = msg["type"]
if kind == "request":
method = msg["method"]
data = BARS if method == "bar" else [] # [] means "genuinely none"
send({"type": method, "id": msg["id"], "data": data})
elif kind == "historyEnd":
p.stdin.close() # nothing more to send
elif kind == "bar":
rows.append(msg["values"])
elif kind == "alert":
alerts.append(msg["message"])
elif kind == "orderFilled":
fills.append(msg) # see "strategy events" below
elif kind == "log":
print(msg["level"], msg["message"]) # the script's own output
elif kind == "error":
raise SystemExit(msg["message"])
elif kind == "done":
break
p.wait()
print(rows[-5:], alerts, fills) # report a summary, not 5000 lines
```
Report a summary — the last few rows, the alerts, an aggregate. Do not forward thousands of
bar lines into your own context.
### Four things to get right, none of them guessable
- **stdout is the script's output, stderr is navi's.** Plot values, alerts, and the
script's own `log.*()` calls all arrive on stdout, every line parsing as JSON. Compile
diagnostics, protocol errors, and timeouts go to stderr as plain text. Read them
separately — **do not merge them with `2>&1`**, or the JSON stream is corrupted.
- **Close stdin when you have no more data.** Past the history boundary the run stays open
waiting for live data, so it will not finish on its own. Ctrl+C also shuts down cleanly,
writing a final `done` line marked `"interrupted": true` and exiting 130.
- **`historyEnd` is a boundary, not a terminator.** Before it, bars execute once as
confirmed history. After it, each bar re-executes on every update it receives. Only
closing stdin — or an `end` line — finishes a stream.
- **A stream nobody answers is an error, not an empty result.** To say a symbol genuinely
has no dividends, answer with an empty array rather than staying silent.
- **Nothing is filtered — a forming bar reports every pass.** Past the boundary a bar
re-executes on each update, and every pass emits its own `bar` line plus whatever alerts,
logs and strategy events it produced. Each line carries the `state` it ran in, so
narrowing is yours to do: `jq 'select(.state != "history")'` for live output only,
`jq 'select(.state == "realtimeNew")'` for one line per bar.
### Strategy events
A `strategy()` script also reports what it traded. The event's own kind is the line type —
there is no wrapper to unwrap:
```
{"type":"orderSubmitted","id":"Long","direction":"long","quantity":100.0,"index":1,"time":…,"state":"history"}
{"type":"orderFilled","id":"Long","price":102.0,"quantity":100.0,"commission":0.0,"index":2,…}
{"type":"tradeOpened","entryId":"Long","entryPrice":102.0,"quantity":100.0,"index":2,…}
```
The kinds are `config`, `orderSubmitted`, `orderFilled`, `orderCancelled`, `tradeOpened`,
`tradeClosed`, `openTradeUpdated`, `equitySnapshot`, `marginCall` and `riskFlatten`. A
backtest emits an `equitySnapshot` per bar — and per tick on a live feed — so filter for
what you care about: `jq 'select(.type == "orderFilled")'`.
### Flags worth knowing
| Flag | Effect |
| --- | --- |
| `--symbol ` | Symbol the script sees as `symbol_info.tickerid`, written `TICKER.MARKET`. Defaults to `AAPL.US`. Include a market suffix (`.US`, `.HK`, `.SH`, `.SZ`, `.SG`) so `mintick`/`timezone`/`currency` resolve; without one the run needs a `symbolInfo` reply carrying `market`. |
| `--timeframe ` | Bar timeframe: bare numbers are minutes, plus `S`/`D`/`W`/`M`/`T`. Defaults to `D`. A `T` timeframe reads ticks, so requests ask for `tick`. |
| `--input ` | Override an `input.*()` default by declaration order from 0. Values are JSON, so quote strings: `--input 1='"close"'`. |
| `--sessions
```navi
indicator("Intraday highs on Daily chart");
// Returns an array of all 1-minute highs within each daily bar
let minute_highs = request.security_lower_tf(syminfo.tickerid, "1", high);
// Highest 1-minute high within the current daily bar
let intraday_high = minute_highs.max();
plot(intraday_high);
```
The array is empty (`minute_highs.size() == 0`) for bars where no sub-bars are
available.
## Ticker Expressions
A ticker expression is a string that combines multiple symbols using arithmetic
operators. Navi decomposes it into individual `DataProvider` requests, evaluates
the expression per bar, and returns the result as a single series.
### Supported operators
| Operator | Example | Result |
|---|---|---|
| `*` | `"AAPL*2"` | symbol value × scalar |
| `/` | `"AAPL/SPY"` | ratio between two symbols |
| `+` | `"AAPL+MSFT"` | sum of two symbols |
| `-` | `"AAPL-MSFT"` | difference of two symbols |
Operands can be symbol strings (`"TICKER.MARKET"`) or numeric literals.
Standard operator precedence applies; use parentheses if needed.
### Examples
**Weighted blend (50/50 portfolio)**
```navi
let blend = request.security("AAPL.US*0.5+SPY.US*0.5", "D", close);
```
**Relative performance (ratio)**
```navi
// AAPL price relative to SPY — how many SPY shares does one AAPL buy?
let ratio = request.security("AAPL.US/SPY.US", "D", close);
plot(ratio);
```
**Spread (difference)**
```navi
// Gold/Silver spread
let spread = request.security("GC1!.US/SI1!.US", "D", close);
plot(spread);
```
**Multi-symbol index**
```navi
// Equal-weight average of four tech stocks
let tech = request.security(
"AAPL.US*0.25+MSFT.US*0.25+GOOGL.US*0.25+AMZN.US*0.25",
"D",
close
);
plot(tech);
```
### How it works
For an expression like `"AAPL*0.5+SPY*0.5"`, Navi:
1. Extracts each symbol (`AAPL`, `SPY`) and fetches their candlestick data via `DataProvider`.
2. On each bar, evaluates the arithmetic expression using the requested `expression` field (e.g. `close`) from each symbol's sub-instance.
3. Returns the computed scalar result aligned to the chart bar.
Each symbol in the expression is subject to the same `max_security_calls` limit as a regular `request.security` call.
## Limitations
- **Nesting**: an expression inside `request.security` may itself call
`request.security`, to any depth. There is no separate depth limit; what
bounds nesting is the child limit below, since every level builds at least
one child.
- **Circular expressions are refused**: if a chain of requests comes back to a
call site it has already passed through, nothing would ever end it. The run
stops with an error naming the cycle instead of exhausting memory.
- **Child limit**: `ExecutionLimits::max_security_calls` (default 40) caps how
many children one run may build. A child is a whole sub-instance — its own
state, series buffers and `bar_index` — and **one call site can cost more
than one**:
- naming a different `symbol` or `timeframe` on a later bar opens a child for
that series too, and keeps the earlier one in case the call site returns to
it;
- an expression that reads another request's result makes that request part
of what this child evaluates, against its own series, so a chain of four
requests reading each other costs ten children rather than four.
Call sites naming the same `(symbol, timeframe)` share the data that is
fetched but not the count, so four fields of one symbol are four.
---
# types-and-variables
# Variables & Qualifiers
## Variable Declaration
Variables can be declared with explicit or inferred types:
```navi
// Type inferred
let a = 10; // inferred as int
let name = "AAPL"; // inferred as String
// Explicit type
let b: float = 3.14;
let label: String = "Buy";
let flag: bool = true;
```
If the type cannot be inferred, an explicit annotation is required:
```navi
let a = na; // ERROR: cannot infer variable type
let a: float = na; // OK
```
## Reassignment
Use `=` to reassign a variable. Compound assignment operators are also supported:
```navi
let a = 10;
a = 20; // Reassignment
a += 5; // a = a + 5
a -= 1; // a = a - 1
a *= 2; // a = a * 2
a /= 3; // a = a / 3
a %= 4; // a = a % 4
```
## Type Qualifiers
Navi has four type qualifiers that describe when a value is known, from most restrictive to least:
| Qualifier | Meaning |
|---|---|
| `const` | Known at compile time, never changes |
| `input` | Known at script startup (e.g., user inputs) |
| `simple` | Known on bar 0, not derived from the current bar's data |
| `series` | Derived from the current bar — a new value on every bar |
```navi
let a: const int = 2;
let b: input int = 10;
let c: simple int = a + b;
let d: series float = close;
```
The qualifier hierarchy flows: `const` -> `input` -> `simple` -> `series`. A value can be auto-promoted up this hierarchy but not demoted.
Only `const` and `input` hold the same value for a whole run. `simple` says the value does not come from bar data — not that it never changes, since a variable holding one can still be reassigned on each bar:
```navi
fn takes_simple(x: simple int): int { x; }
var n = 0;
n = n + 1; // `n` is `simple int`, and counts 1, 2, 3, …
plot(float(takes_simple(n)));
```
## `var` — Initialize Once, Persist Across Bars
Without a declaration mode, variables are re-initialized on **every script execution** (every bar, every tick). The `var` keyword changes this — the variable is initialized **only once** on the first bar, and retains its last assigned value on all subsequent bars:
```navi
indicator("Green Bars Count");
var count = 0;
let isGreen = close >= open;
if isGreen {
count = count + 1;
}
plot(count);
```
Without `var`, `count` would reset to `0` on every bar, so the plot would only show `0` or `1`. With `var`, the value accumulates across bars.
### `var` inside `if` blocks
`var` can be used inside `if` blocks. The variable is initialized on the **first execution that enters the block**:
```navi
var a = close;
var b = 0.0;
if close > open {
var x = close; // initialized once when this branch first executes
b = x;
}
```
### `var` with collections
`var` works with all types including arrays and objects. A `var` array persists and can grow across bars:
```navi
var a = Array.new(0);
a.push(close); // array grows by 1 element on each bar
```
### Real-time behavior of `var`
On historical bars, `var` and non-`var` behave identically because the script runs exactly once per bar. The difference is visible on **real-time bars**: without `var`, the variable resets on each tick; with `var`, it retains its value across ticks but is subject to **rollback** when the bar closes (the value reverts to what it was at the last confirmed bar, then re-executes once for the new confirmed bar).
## `varip` — Persist Without Rollback
`varip` (var intrabar persist) is similar to `var` — initialized only once. The key difference is that `varip` variables are **not subject to rollback** on real-time bars. They retain their values across all executions, including multiple ticks within the same unconfirmed bar:
```navi
indicator("varip demo");
varip updateCount: int = na;
if barstate.is_new {
updateCount = 1;
} else {
updateCount = updateCount + 1;
}
plot(updateCount, style: PlotStyle.Circles);
```
This is useful for tracking tick-level data. On historical bars, `varip` behaves identically to `var`.
### `varip` on type fields
`varip` can be used on individual type fields to make them persist across intrabar updates while other fields still roll back:
```navi
struct Counter {
bars: int = 0,
varip ticks: int = 0,
}
var counter: Counter = Counter.new();
counter.bars += 1; // subject to rollback on unconfirmed bars
counter.ticks += 1; // NOT subject to rollback
```
### Comparison Table
| Behavior | No keyword | `var` | `varip` |
|---|---|---|---|
| Initialization | Every execution | Once (first bar) | Once (first bar) |
| Historical bars | Re-init each bar | Persists | Persists |
| Real-time ticks | Re-init each tick | Persists (with rollback) | Persists (no rollback) |
## Tuple Destructuring
Functions that return tuples can be destructured with `(...)` syntax:
```navi
let (median, upperBand, lowerBand) = ta.bb(close, 20, 2.0);
plot(median);
plot(upperBand);
plot(lowerBand);
```
## Discard (`_`)
Use `_` to discard unwanted values. It can be used multiple times:
```navi
let (_, upper, _) = ta.bb(close, 20, 2.0);
let _ = someFunction(); // Discard return value
let _ = anotherFunction();
```
## `na` — Missing Values
`na` represents a missing or undefined value. Many functions return `na` when there isn't enough data:
```navi
let sma5 = ta.sma(close, 5); // na for the first 4 bars
// Check for na with na()
if not na(sma5) {
label.new(bar_index, sma5, String.from(sma5));
}
```
Use `nz()` to replace `na` with a default:
```navi
let value = nz(ta.sma(close, 5), 0.0); // Replace na with 0
```
Use `fixnan()` to replace `na` with the last non-na value:
```navi
let value = fixnan(ta.sma(close, 5));
```
## Next Steps
- [Control Structures](/docs/control-structures) — if, for, while, switch
- [Functions & Methods](/docs/functions-and-methods) — defining and calling functions
---
# skill
## Install
Add the `navi` skill to your AI coding agent with the [Skills CLI](https://github.com/vercel-labs/skills):
```bash
npx skills add longbridge/navi
```
## Update
Pull the latest version of the skill whenever the docs change:
```bash
npx skills update navi
```
See the [AI Assistant guide](/docs/ai) for agent-specific options and usage.
---
# SKILL
Write valid Navi code for chart indicators, strategies, and reusable libraries. Keep every answer focused on Navi authoring: syntax, execution semantics, standard-library calls, and practical script patterns.
## Source of Truth
Navi's standard library and, occasionally, its syntax evolve. This skill captures the stable authoring model — it deliberately does **not** reproduce the full API. Treat **navi-lang.org** as authoritative and verify concrete API details there instead of trusting memory or any list embedded in this skill.
- Full documentation in one file (language guide + complete stdlib API):
- Documentation index, per topic — fetch a single page on demand:
- Any single doc page as raw markdown: use the exact URL listed in `llms.txt`, e.g.
Before using any concrete API — a function name, signature, enum variant, or method name — confirm it against the source above. When unsure, fetch `llms-full.txt` (or the specific page) rather than guessing.
Never construct a documentation URL from a symbol name. Fetch `llms.txt` first and copy an exact link from it. In particular:
- Guide pages live under `/docs/`, not `/ai/` or `/guide/`.
- Namespace/module pages use `/api/stdlib//index.md`.
- Prelude types and enums use `/api/stdlib/prelude/.md`, such as `Table.md` and `PlotDisplay.md`; they do not have nested `index.md` pages.
- Free prelude functions such as `plot`, `bg_color`, `na`, and `nz` are sections of `/api/stdlib/prelude/index.md`; they do not have one page per function.
- If a guessed URL returns 404, stop guessing paths and return to `llms.txt`.
## Reference Map
Load only the reference needed for the task:
| Read this | When you need to... |
| --- | --- |
| [references/syntax.md](references/syntax.md) | Check Navi source syntax: statements, blocks, declarations, types, collections, functions, methods, structs, enums, imports, and exports. |
| [references/execution-model.md](references/execution-model.md) | Reason about bar-by-bar execution, series values, qualifiers, `var`/`varip`, rollback, `na`, history references, and repainting. |
| [references/stdlib.md](references/stdlib.md) | Learn the stdlib naming rules and how to look up exact API names, signatures, and enum variants on navi-lang.org. |
| [references/patterns.md](references/patterns.md) | Start from complete indicator/strategy/library templates or reuse idioms for warmup guards, crosses, state, arrays, MTF data, divergence, debugging, and output polish. |
| [references/cli.md](references/cli.md) | Install the `navi` CLI, or run a script to see what it computes: `navi check`/`fmt`/`run`, the stdin NDJSON protocol, and driver patterns. |
## Authoring Workflow
1. Identify the script kind: `indicator()` for visual studies, `strategy()` for orders/backtests, or `library()` for exported helpers.
2. Put configuration first with `input.*()` calls. Prefer typed inputs (`input.int`, `input.float`, `input.source`, `input.string`, `input.bool`) and use stable titles.
3. Model time correctly. Treat `close`, `high`, `ta.*` outputs, conditions, and plots as per-bar `series` values. Use `x[1]` for prior bars.
4. Use `let` for per-bar calculations, `var` for state that must persist across bars, and `varip` only for intentional intrabar state.
5. Guard warmup and missing values with `na()`, `nz()`, or `fixnan()`; never assume `na` is zero.
6. Confirm standard-library API names and signatures against navi-lang.org (`llms.txt`, then its exact page link) before using them; do not rely on remembered lists or synthesize URLs. As a rule, Navi built-in functions are snake_case (e.g. `ta.cross_over`, `bg_color`) and types/enums are PascalCase (e.g. `Direction.Long`).
7. Make outputs deterministic and readable: stable plot order, clear titles, explicit colors, and `na` or `PlotDisplay.NONE` when hiding output.
8. When returning code, return complete `.nv` source unless the user asked for only a fragment.
## Naming Style
Follow these Navi naming conventions consistently:
- Use `snake_case` for variables, parameters, functions, methods, and properties: `fast_length`, `long_signal`, `ema_of`.
- Use `PascalCase` for structs, enums, newtypes, and enum variants: `TradeState`, `Direction.Long`.
- Use `SCREAMING_SNAKE_CASE` for compile-time constants: `MAX_LOOKBACK`.
- Use `snake_case.nv` for new filenames when repository conventions allow it.
## CLI Validation
Validate every complete `.nv` file you create or modify with the `navi` CLI. Read
[references/cli.md](references/cli.md) before the first CLI call in a session — installation,
every flag, and the `navi run` wire protocol are there.
1. `navi check path/to/script.nv` — the completion gate: syntax, types, compilation, imports.
2. `navi fmt path/to/script.nv` — canonical formatting. Independent of compilation, so run both.
3. `navi run path/to/script.nv`, with market data on stdin, when the task turns on
what the script computes rather than whether it compiles.
4. Treat every non-zero exit status as a failed validation. Fix the script and repeat until
every command exits successfully; report the commands run and any validation that could not
be completed.
Pass several paths in one call rather than one call per file — `check` and `fmt` both accept
files, directories, and quoted glob patterns.
`navi run` executes the script against data you provide; the CLI bundles none and downloads
none. Its stdout is pure NDJSON (plot values, alerts, and the script's own `log.*()`) and its
stderr is human-readable diagnostics — capture them separately, **never `2>&1`**, or the JSON
stream is corrupted.
Do not claim that a code fragment was CLI-validated unless it was placed in a complete `.nv`
script and the command succeeded.
## Playground Preview Links
When a user wants an online preview, encode the complete UTF-8 source as unpadded Base64URL and append it as the `code` query parameter:
```text
https://navi-lang.org/playground?code=
```
Base64URL uses `-` and `_` instead of `+` and `/`, with trailing `=` padding removed. Generate this link only after CLI validation, and keep the full script in the response because very large scripts may exceed browser or chat URL limits.
## Navi Essentials
- Every script begins with `indicator(...)`, `strategy(...)`, or `library(...)`.
- Statements end with `;`. Block declarations such as `fn`, `if`, `for`, `while`, `switch`, `struct`, and `enum` end with `}` when used standalone.
- Type annotations use `name: type`, with qualifiers before the type: `let ma: series float = close;`.
- Collections are PascalCase: `Array`, `Map`, `Matrix`. Construct with `Array.new()`, `Map.new()`, and `Matrix.new()`.
- Tuples use parentheses and must be immediately destructured: `let (basis, upper, lower) = ta.bb(close, 20, 2.0);`.
- Navi has no `return` keyword. A function or expression block yields its last statement.
- Use PascalCase enums: `Shape.TriangleUp`, `Location.BelowBar`, `PlotStyle.Histogram`, `Direction.Long`, `BarmergeLookahead.Off`.
## Starter Templates
Minimal indicator:
```navi
indicator("My Indicator", overlay: true);
let len = input.int(14, "Length", minval: 1);
let src = input.source(close, "Source");
let ma = ta.sma(src, len);
plot(ma, "SMA", color: Color.ORANGE);
```
Minimal strategy:
```navi
strategy("MA Cross", overlay: true);
let fast_len = input.int(10, "Fast Length", minval: 1);
let slow_len = input.int(20, "Slow Length", minval: 1);
let fast = ta.ema(close, fast_len);
let slow = ta.ema(close, slow_len);
let long_signal = ta.cross_over(fast, slow);
let short_signal = ta.cross_under(fast, slow);
if long_signal {
strategy.entry("Long", Direction.Long);
}
if short_signal {
strategy.entry("Short", Direction.Short);
}
plot(fast, "Fast EMA", color: Color.GREEN);
plot(slow, "Slow EMA", color: Color.RED);
```
Reusable library:
```navi
// @description Shared moving-average helpers.
library("MaLib");
// @function Calculates an exponential moving average.
// @param src Source series.
// @param length EMA length.
// @returns EMA series.
// @see func:ta.sma
// @see func:ta.wma
export fn ema_of(src: series float, length: simple int): series float {
ta.ema(src, length);
}
```
---
# cli
# CLI Reference
The standalone `navi` CLI is a compiler, a formatter, and a runner. It contains no market
data and downloads none, but `navi run` does execute scripts against data you supply on
stdin. Its role in an authoring session is to prove three things: the script compiles, it
is canonically formatted, and it computes what you expect.
Use `navi --help` for current, detailed behavior; `-h` only prints a summary.
## Installing
Check first with `command -v navi` (`Get-Command navi` on Windows). If it is missing,
install it when local tool installation is in scope; otherwise give the command to the user.
macOS or Linux:
```bash
curl -fsSL https://navi-lang.org/install.sh | sh
```
Windows PowerShell:
```powershell
irm https://navi-lang.org/install.ps1 | iex
```
Both scripts download a prebuilt binary — no toolchain, no compilation from source.
## `navi check` — the completion gate
```bash
navi check path/to/script.nv
```
Checks syntax, types, compilation, and imports. This is the default gate: a script is not
finished until it passes.
## `navi fmt` — canonical formatting
```bash
navi fmt path/to/script.nv # rewrite in place
navi fmt --check path/to/script.nv # report differences, write nothing
```
Formatting is independent of compilation, so run both commands.
## Validating several files at once
Both commands take any number of paths, and each may be a file, a directory, or a glob —
prefer one call over one call per file:
```bash
navi check "src/**/*.nv"
navi fmt src
```
Quote glob patterns so `navi` expands them itself. Matching no files is an error, so a
mistyped pattern fails rather than silently passing.
## `navi run` — checking what a script computes
`navi run` executes the script against market data you provide on stdin as NDJSON, and
writes each bar's `plot()` values, alerts, `log.*()` output and strategy events to stdout
as NDJSON. It is the first
choice for confirming behavior. Reach for `longbridge quant run`, a Longbridge MCP server,
or the Playground only when the task needs real market data rather than data you supply.
### Without a driver
Send one line carrying the whole dataset and read the output directly. Enough for "run this
over these bars and show me the values", and — piped through `jq` — for an alert-only check:
```bash
echo '{"type":"bar","data":[{"time":1700006400000,"close":103},{"time":1700092800000,"close":107}]}' \
| navi run script.nv
```
`data` accepts a single object or an array, and an array implies the history boundary. A
`.json` file of candles can be piped straight in:
```bash
jq -c '{type:"bar",data:.}' bars.json | navi run script.nv
```
### With a driver
Write a small program that reads stdout, answers each `request` line by its `id`, and
reports only what you need. Required for any script using `request.security`,
`request.dividends`, or `request.data`, and for continuous monitoring.
```python
import json, subprocess
BARS = [{"time": 1700006400000 + i * 86400000, "close": 100 + i} for i in range(3)]
p = subprocess.Popen(["navi", "run", "script.nv"],
stdin=subprocess.PIPE, stdout=subprocess.PIPE, text=True)
def send(obj):
p.stdin.write(json.dumps(obj) + "\n")
p.stdin.flush()
rows, alerts, fills = [], [], []
while True:
# An explicit readline loop: `for line in p.stdout` reads ahead and can
# block against a process that is waiting for your answer.
line = p.stdout.readline()
if not line:
break
msg = json.loads(line)
kind = msg["type"]
if kind == "request":
method = msg["method"]
data = BARS if method == "bar" else [] # [] means "genuinely none"
send({"type": method, "id": msg["id"], "data": data})
elif kind == "historyEnd":
p.stdin.close() # nothing more to send
elif kind == "bar":
rows.append(msg["values"])
elif kind == "alert":
alerts.append(msg["message"])
elif kind == "orderFilled":
fills.append(msg) # see "strategy events" below
elif kind == "log":
print(msg["level"], msg["message"]) # the script's own output
elif kind == "error":
raise SystemExit(msg["message"])
elif kind == "done":
break
p.wait()
print(rows[-5:], alerts, fills) # report a summary, not 5000 lines
```
Report a summary — the last few rows, the alerts, an aggregate. Do not forward thousands of
bar lines into your own context.
### Four things to get right, none of them guessable
- **stdout is the script's output, stderr is navi's.** Plot values, alerts, and the
script's own `log.*()` calls all arrive on stdout, every line parsing as JSON. Compile
diagnostics, protocol errors, and timeouts go to stderr as plain text. Read them
separately — **do not merge them with `2>&1`**, or the JSON stream is corrupted.
- **Close stdin when you have no more data.** Past the history boundary the run stays open
waiting for live data, so it will not finish on its own. Ctrl+C also shuts down cleanly,
writing a final `done` line marked `"interrupted": true` and exiting 130.
- **`historyEnd` is a boundary, not a terminator.** Before it, bars execute once as
confirmed history. After it, each bar re-executes on every update it receives. Only
closing stdin — or an `end` line — finishes a stream.
- **A stream nobody answers is an error, not an empty result.** To say a symbol genuinely
has no dividends, answer with an empty array rather than staying silent.
- **Nothing is filtered — a forming bar reports every pass.** Past the boundary a bar
re-executes on each update, and every pass emits its own `bar` line plus whatever alerts,
logs and strategy events it produced. Each line carries the `state` it ran in, so
narrowing is yours to do: `jq 'select(.state != "history")'` for live output only,
`jq 'select(.state == "realtimeNew")'` for one line per bar.
### Strategy events
A `strategy()` script also reports what it traded. The event's own kind is the line type —
there is no wrapper to unwrap:
```
{"type":"orderSubmitted","id":"Long","direction":"long","quantity":100.0,"index":1,"time":…,"state":"history"}
{"type":"orderFilled","id":"Long","price":102.0,"quantity":100.0,"commission":0.0,"index":2,…}
{"type":"tradeOpened","entryId":"Long","entryPrice":102.0,"quantity":100.0,"index":2,…}
```
The kinds are `config`, `orderSubmitted`, `orderFilled`, `orderCancelled`, `tradeOpened`,
`tradeClosed`, `openTradeUpdated`, `equitySnapshot`, `marginCall` and `riskFlatten`. A
backtest emits an `equitySnapshot` per bar — and per tick on a live feed — so filter for
what you care about: `jq 'select(.type == "orderFilled")'`.
### Flags worth knowing
| Flag | Effect |
| --- | --- |
| `--symbol ` | Symbol the script sees as `symbol_info.tickerid`, written `TICKER.MARKET`. Defaults to `AAPL.US`. Include a market suffix (`.US`, `.HK`, `.SH`, `.SZ`, `.SG`) so `mintick`/`timezone`/`currency` resolve; without one the run needs a `symbolInfo` reply carrying `market`. |
| `--timeframe ` | Bar timeframe: bare numbers are minutes, plus `S`/`D`/`W`/`M`/`T`. Defaults to `D`. A `T` timeframe reads ticks, so requests ask for `tick`. |
| `--input ` | Override an `input.*()` default by declaration order from 0. Values are JSON, so quote strings: `--input 1='"close"'`. |
| `--sessions ` | Declares which sessions the bars cover. **Not a filter** — an unlisted `tradeSession` aborts the run, and it changes `session.*`/`symbol_info.session` semantics. Pre/post-market data needs `--sessions regular,extended`. |
| `--request-timeout ` | Idle timeout for an unanswered `request.*`, armed only until that stream's history boundary. Defaults to 30000; `0` waits forever. |
| `--max-bars-back ` | Lookback cap, default 1000. A script's own `max_bars_back()` is clamped to it; `run` warns on stderr when the clamp bites. |
Run `navi run --help` for the full wire protocol: every line type with a literal example,
the routing rules, and a complete request/response transcript.
## Exit status
`0` means success. Every non-zero status is a failed validation — fix the script and repeat
until every command exits successfully. `130` is a Ctrl+C shutdown of `navi run`, not a
script failure.
Do not claim that a code fragment was CLI-validated unless it was placed in a complete
`.nv` script and the command succeeded.
---
# execution-model
# Navi Execution Model
Use this file when a script depends on previous bars, persistent state, missing values, realtime updates, or multi-timeframe data.
These execution semantics are stable, but confirm anything that looks off against navi-lang.org — the guide at (full text: ).
## Table of Contents
- [Bar-by-Bar Evaluation](#bar-by-bar-evaluation)
- [Series Values](#series-values)
- [Type Qualifiers](#type-qualifiers)
- [`let`, `var`, and `varip`](#let-var-and-varip)
- [Realtime Rollback](#realtime-rollback)
- [`na` Values](#na-values)
- [History References](#history-references)
- [Non-Repainting Rules](#non-repainting-rules)
- [`request.security`](#requestsecurity)
## Bar-by-Bar Evaluation
Navi evaluates the whole script once per bar from oldest to newest. On each bar, every top-level statement runs again with the current bar's `open`, `high`, `low`, `close`, `volume`, `time`, and related values.
```navi
indicator("Per-bar example");
let range = high - low; // recalculated on every bar
plot(range, "Range");
```
Plain `let` variables do not remember previous bars. Use either history references (`x[1]`) or persistent declarations (`var`/`varip`) depending on the problem.
## Series Values
A `series` value is the sequence of values produced as the script runs bar by bar. Price data, most indicator outputs, conditions based on price, and plot values are `series`.
```navi
let ma: series float = ta.sma(close, 20);
let rising: series bool = close > close[1];
```
Use history references to read a prior element of a series:
```navi
let change = close - close[1];
```
## Type Qualifiers
Qualifiers describe when a value is known:
| Qualifier | Known when | Can vary by bar? |
| --- | --- | --- |
| `const` | compile time | no |
| `input` | script startup/settings | no during a run |
| `simple` | first bar | no |
| `series` | each bar | yes |
The hierarchy flows one way:
```text
const -> input -> simple -> series
```
A value can be promoted to a less restrictive qualifier but cannot be demoted.
```navi
let fixed: const int = 2;
let len: input int = input.int(14, "Length");
let source: series float = close;
```
Always check the API signature when passing lengths or options. Some `ta.*` functions accept `series int` lengths; others require `simple int`. If a parameter is `simple`, pass a literal, `const`, `input`, or value that does not vary by bar.
```navi
let len = input.int(14, "Length", minval: 1);
plot(ta.ema(close, len)); // OK: input int can satisfy simple int
let dynamic_len = int(close);
// plot(ta.ema(close, dynamic_len)); // error if the signature requires simple int
```
## `let`, `var`, and `varip`
| Declaration | Initialization | Historical bars | Realtime ticks |
| --- | --- | --- | --- |
| `let` | every execution | recalculated | recalculated |
| `var` | first execution | persists | persists with rollback |
| `varip` | first execution | persists | persists without rollback |
Use `let` for ordinary calculations:
```navi
let body = math.abs(close - open);
```
Use `var` for state accumulated across bars:
```navi
indicator("Green Bar Count");
var count = 0;
if close >= open {
count += 1;
}
plot(count, "Count");
```
`var` can be initialized inside a branch; it initializes the first time that branch runs.
```navi
if close > open {
var first_green_close = close;
log.info(String.from(first_green_close));
}
```
Use persistent collections with `var`:
```navi
var window: Array = Array.new();
window.push(close);
if window.size() > 50 {
window.shift();
}
plot(window.avg(), "Window average");
```
Use `varip` only for intentional intrabar state:
```navi
varip updates: int = 0;
if bar_state.is_new {
updates = 1;
} else {
updates += 1;
}
plot(updates, "Realtime updates");
```
`varip` can also be applied to struct fields:
```navi
struct Counter {
bars: int = 0,
varip ticks: int = 0,
}
var c: Counter = Counter.new();
c.bars += 1;
c.ticks += 1;
```
## Realtime Rollback
Historical bars are evaluated once. The current realtime bar may be evaluated many times before it is confirmed.
On each realtime update:
- `let` values recalculate normally.
- `var` values roll back to their last confirmed-bar value, then the script recalculates.
- `varip` values do not roll back and continue accumulating within the unconfirmed bar.
Prefer `var` for outputs that should match historical replay. Use `varip` only when tick-level behavior is the actual goal.
## `na` Values
`na` means missing or unavailable. It propagates through most calculations and appears during warmup, missing data, invalid optional outputs, and insufficient history.
```navi
let sma5 = ta.sma(close, 5);
plot(not na(sma5) ? sma5 : na, "SMA 5");
```
Helpers:
- `na(x)` tests whether `x` is missing.
- `nz(x, replacement)` returns `replacement` when `x` is `na`; the default replacement is zero.
- `fixnan(x)` replaces `na` with the last non-`na` value.
```navi
let safe_volume = nz(volume, 0.0);
let held_ma = fixnan(ta.sma(close, 20));
```
Annotate `na` when used alone:
```navi
var peak: float = na;
```
## History References
`x[n]` returns the value `x` produced `n` bars ago. It reads the already-computed historical value; it does not recompute the expression.
```navi
let prev_close = close[1];
let prev_sma = ta.sma(close, 14)[1];
let prev_range = (high - low)[1];
```
Rules:
- Offsets are non-negative integers and may be series expressions.
- Insufficient early history yields `na`.
- History references promote the result to `series`.
- Chaining is additive: `close[1][1]` is the same as `close[2]`.
- Use `max_bars_back(seriesRef, count)` only when a script needs a larger history buffer.
Manual cross logic:
```navi
let crossed_up = fast > slow and fast[1] <= slow[1];
let crossed_down = fast < slow and fast[1] >= slow[1];
```
Prefer `ta.cross_over(fast, slow)` and `ta.cross_under(fast, slow)` when their boundary behavior matches the script.
## Non-Repainting Rules
A script repaints when a historical bar's final value differs from what would have been visible while that bar was forming.
Default to these rules:
- Base plotted signals on values available at that bar.
- Gate final alerts/orders on `bar_state.is_confirmed` when the signal must wait for bar close.
- Avoid `varip` in historical-looking plots unless the realtime-only nature is intentional.
- Avoid lookahead in `request.security`; prefer `BarmergeLookahead.Off`.
- Be careful with pivot functions: pivots confirm only after enough right-side bars exist, so signal placement may naturally appear delayed.
Confirmed-bar side effect:
```navi
let long_signal = ta.cross_over(fast, slow);
if long_signal and bar_state.is_confirmed {
alert("Long signal", AlertFreq.OncePerBarClose);
}
```
## `request.security`
`request.security(symbol, timeframe, expression, ...)` evaluates `expression` on another symbol or timeframe and aligns the result to the current chart.
```navi
let weekly_close = request.security(symbol_info.tickerid, "W", close);
plot(weekly_close, "Weekly Close");
```
A symbol is written `TICKER.MARKET` — `AAPL.US`, `0700.HK`, `600519.SH`. The market
suffix is one of `US`, `HK`, `SH`, `SZ`, `SG`, and it is what `mintick`, `timezone`,
`currency` and session handling are derived from. Read the parts back with
`symbol_info.ticker` and `symbol_info.market`, and the whole with
`symbol_info.tickerid`.
Instruments outside those markets — crypto and forex pairs, for instance — are written
bare (`BTCUSDT`, `EURUSD`), and the data provider resolves them.
```navi
let spy_close = request.security("SPY.US", "D", close);
// Build one from parts rather than concatenating strings.
let other = request.security(ticker.new(symbol_info.market, "MSFT"), "D", close);
```
Guidelines:
- Use `gaps: BarmergeGaps.On` only when you want `na` between confirmed higher-timeframe bars.
- Keep `lookahead: BarmergeLookahead.Off` unless future-looking historical alignment is intentional.
- Use confirmed values, such as `close[1]`, when a higher-timeframe value must not update intrabar.
- Do not declare `var` or `varip` inside the `expression` argument. Declare state at top level, then request that state.
Tuple request:
```navi
let (w_open, w_high, w_low, w_close) =
request.security(symbol_info.tickerid, "W", (open, high, low, close));
plot_candle(w_open, w_high, w_low, w_close, title: "Weekly OHLC");
```
Lower-timeframe request returns an `Array`:
```navi
let lows = request.security_lower_tf(symbol_info.tickerid, "1", low);
let intrabar_low = lows.size() > 0 ? lows.min() : na;
plot(intrabar_low, "1m low inside bar");
```
---
# patterns
# Navi Patterns and Templates
Use these templates when writing complete `.nv` scripts. Prefer the simplest pattern that matches the request, then adapt names, inputs, colors, and plots.
The concrete API names, enum variants, and signatures shown here are illustrative and can change. Confirm specifics against navi-lang.org (`llms-full.txt` or the relevant page) as you adapt a template.
## Table of Contents
- [Complete Templates](#complete-templates)
- [Core Patterns](#core-patterns)
- [Signals and Crosses](#signals-and-crosses)
- [State and Collections](#state-and-collections)
- [Multi-Timeframe Patterns](#multi-timeframe-patterns)
- [Pivot and Divergence Patterns](#pivot-and-divergence-patterns)
- [Strategy Patterns](#strategy-patterns)
- [Common Pitfalls](#common-pitfalls)
- [Debugging and Review Checklist](#debugging-and-review-checklist)
## Complete Templates
### Indicator
```navi
indicator("My Indicator", overlay: true);
let len = input.int(14, "Length", minval: 1);
let src = input.source(close, "Source");
let ma = ta.sma(src, len);
let ready = not na(ma);
plot(ready ? ma : na, "SMA", color: Color.ORANGE, line_width: 2);
```
### Oscillator Pane
```navi
indicator("My Oscillator", overlay: false, format: Format.Price, precision: 2);
let len = input.int(14, "Length", minval: 1);
let osc = ta.rsi(close, len);
plot(osc, "RSI", color: Color.PURPLE);
hline(70, "Overbought", color: Color.RED, line_style: HLineStyle.Dashed);
hline(30, "Oversold", color: Color.GREEN, line_style: HLineStyle.Dashed);
```
### Strategy
```navi
strategy("MA Cross Strategy", overlay: true, default_qty_type: DefaultQtyType.Fixed, default_qty_value: 1);
let fast_len = input.int(10, "Fast Length", minval: 1);
let slow_len = input.int(20, "Slow Length", minval: 1);
let fast = ta.ema(close, fast_len);
let slow = ta.ema(close, slow_len);
let long_signal = ta.cross_over(fast, slow);
let short_signal = ta.cross_under(fast, slow);
if long_signal and bar_state.is_confirmed {
strategy.entry("Long", Direction.Long);
}
if short_signal and bar_state.is_confirmed {
strategy.entry("Short", Direction.Short);
}
plot(fast, "Fast EMA", color: Color.GREEN);
plot(slow, "Slow EMA", color: Color.RED);
```
### Library
```navi
// @description Shared technical-analysis helpers.
library("TaHelpers");
// @function Selects a moving average by name.
// @param src Source series.
// @param length Moving-average length.
// @param maType Moving-average type.
// @returns Moving-average series.
// @see func:ta.ema
// @see func:ta.sma
export fn ma(src: series float, length: simple int, ma_type: simple String): series float {
let result = switch ma_type {
"EMA" => ta.ema(src, length),
"SMA" => ta.sma(src, length),
"RMA" => ta.rma(src, length),
"WMA" => ta.wma(src, length),
=> ta.ema(src, length),
};
result;
}
```
## Core Patterns
### Selectable Moving Average
```navi
let ma_type = input.string("EMA", "MA Type", options: ["EMA", "SMA", "RMA", "WMA"]);
let len = input.int(20, "Length", minval: 1);
let ma = switch ma_type {
"EMA" => ta.ema(close, len),
"SMA" => ta.sma(close, len),
"RMA" => ta.rma(close, len),
"WMA" => ta.wma(close, len),
=> ta.ema(close, len),
};
plot(ma, "MA", color: Color.ORANGE);
```
### Warmup Guard
```navi
let len = input.int(20, "Length", minval: 1);
let ma = ta.sma(close, len);
let ready = not na(ma);
plot(ready ? ma : na, "SMA");
```
### Conditional Output
```navi
let show_bands = input.bool(true, "Show Bands");
let (basis, upper, lower) = ta.bb(close, 20, 2.0);
plot(basis, "Basis", color: Color.BLUE);
plot(show_bands ? upper : na, "Upper", color: Color.RED);
plot(show_bands ? lower : na, "Lower", color: Color.GREEN);
```
### Stable Plot Handles for Fill
```navi
let (basis, upper, lower) = ta.bb(close, 20, 2.0);
let upper_plot = plot(upper, "Upper", color: Color.RED);
let lower_plot = plot(lower, "Lower", color: Color.GREEN);
fill(upper_plot, lower_plot, Color.new(Color.BLUE, 90), title: "Band Fill");
plot(basis, "Basis", color: Color.ORANGE);
```
## Signals and Crosses
Use built-ins for ordinary cross logic:
```navi
let fast = ta.ema(close, 10);
let slow = ta.ema(close, 20);
let cross_up = ta.cross_over(fast, slow);
let cross_down = ta.cross_under(fast, slow);
plot_shape(cross_up, title: "Cross Up", style: Shape.TriangleUp, location: Location.BelowBar, color: Color.GREEN);
plot_shape(cross_down, title: "Cross Down", style: Shape.TriangleDown, location: Location.AboveBar, color: Color.RED);
```
Spell out the boundary when `>`/`>=` details matter:
```navi
let crossed_up = fast > slow and fast[1] <= slow[1];
let crossed_down = fast < slow and fast[1] >= slow[1];
```
Gate confirmed signals when alerts/orders should wait for bar close:
```navi
let signal = ta.cross_over(fast, slow);
let confirmed_signal = signal and bar_state.is_confirmed;
alert_condition(confirmed_signal, "Long", "Long signal");
```
## State and Collections
### Running State with `var`
```navi
var peak: float = na;
if na(peak) or high > peak {
peak = high;
}
plot(peak, "Peak", color: Color.GREEN);
```
### Count Consecutive Bars
```navi
let is_up = close > open;
var count = 0;
count = is_up ? count + 1 : 0;
plot(count, "Up count");
```
### Rolling Array Window
```navi
let size = input.int(50, "Window", minval: 1);
var window: Array = Array.new();
window.push(close);
if window.size() > size {
window.shift();
}
plot(window.avg(), "Window Average");
```
### Intrabar Counter with `varip`
```navi
varip updates: int = 0;
if bar_state.is_new {
updates = 1;
} else {
updates += 1;
}
plot(updates, "Realtime Updates", style: PlotStyle.Histogram);
```
Use `varip` only when realtime tick counting is intended.
## Multi-Timeframe Patterns
### Higher-Timeframe Series
```navi
indicator("Weekly MA", overlay: true);
let weekly_ma = request.security(symbol_info.tickerid, "W", ta.sma(close, 20), lookahead: BarmergeLookahead.Off);
plot(weekly_ma, "Weekly SMA", color: Color.ORANGE);
```
### Confirmed Higher-Timeframe Value
Use prior higher-timeframe values when live updating of the current higher-timeframe bar would repaint a signal.
```navi
let weekly_close_confirmed = request.security(symbol_info.tickerid, "W", close[1], lookahead: BarmergeLookahead.Off);
plot(weekly_close_confirmed, "Confirmed Weekly Close");
```
### Lower-Timeframe Aggregation
```navi
let lows = request.security_lower_tf(symbol_info.tickerid, "1", low);
let intrabar_low = lows.size() > 0 ? lows.min() : na;
plot(intrabar_low, "Intrabar Low");
```
## Pivot and Divergence Patterns
Pivot functions return `na` except when a pivot is confirmed. The pivot value corresponds to the pivot bar, usually plotted with a negative `offset` equal to the right lookback.
```navi
let left = input.int(5, "Left", minval: 1);
let right = input.int(5, "Right", minval: 1);
let ph = ta.pivot_high(high, left, right);
let pl = ta.pivot_low(low, left, right);
plot_shape(not na(ph), title: "Pivot High", style: Shape.TriangleDown, location: Location.AboveBar, offset: -right, color: Color.RED);
plot_shape(not na(pl), title: "Pivot Low", style: Shape.TriangleUp, location: Location.BelowBar, offset: -right, color: Color.GREEN);
```
Simple bearish divergence scaffold:
```navi
let left = input.int(5, "Left", minval: 1);
let right = input.int(5, "Right", minval: 1);
let osc = ta.rsi(close, 14);
let ph = ta.pivot_high(osc, left, right);
let have_pivot = not na(ph);
let curr_price = ta.value_when(have_pivot, high[right], 0);
let prev_price = ta.value_when(have_pivot, high[right], 1);
let curr_osc = ta.value_when(have_pivot, osc[right], 0);
let prev_osc = ta.value_when(have_pivot, osc[right], 1);
let bearish_div = have_pivot
and curr_price > prev_price
and curr_osc < prev_osc;
plot_shape(bearish_div, title: "Bear Div", style: Shape.TriangleDown, location: Location.AboveBar, offset: -right, color: Color.RED);
```
## Strategy Patterns
### Entry and Close
```navi
let long_signal = ta.cross_over(fast, slow);
let exit_signal = ta.cross_under(fast, slow);
if long_signal and bar_state.is_confirmed {
strategy.entry("Long", Direction.Long);
}
if exit_signal and bar_state.is_confirmed {
strategy.close("Long");
}
```
### Stop/Limit Exit
```navi
let atr = ta.atr(14);
let stop_price = strategy.position_avg_price - atr * 2.0;
let take_price = strategy.position_avg_price + atr * 3.0;
if strategy.position_size > 0 {
strategy.exit("Long Exit", "Long", stop: stop_price, limit: take_price);
}
```
### Risk Guard
```navi
strategy.risk.max_drawdown(20, DefaultQtyType.PercentOfEquity);
strategy.risk.max_position_size(10);
```
## Common Pitfalls
- Confirm API names against navi-lang.org rather than trusting memory. Built-in functions are snake_case (e.g. `ta.cross_over`), never a camelCase alias.
- Do not write lowercase collection types (`array`, `map`, `matrix`). Use `Array`, `Map`, and `Matrix`.
- Do not compare `na` with `==`; use `na(x)` or `not na(x)`.
- Do not use a `series` value for a parameter that the API marks `simple`, `input`, or `const`.
- Do not store tuples; destructure them immediately.
- Do not use `varip` unless realtime intrabar behavior is required.
- Do not let plot order change across refactors.
- Do not depend on `request.security(..., lookahead: BarmergeLookahead.On)` unless future-looking alignment is intentionally requested.
- Do not use recursion; rewrite as a loop.
## Debugging and Review Checklist
Before returning a script:
- The script starts with `indicator`, `strategy`, or `library`.
- All statements that need semicolons have them.
- Function and struct annotations use `name: type`.
- API names and signatures verified against navi-lang.org (`llms-full.txt` or the specific page).
- Warmup `na` behavior is handled for rolling calculations.
- Crosses use either `ta.cross_over`/`ta.cross_under` or explicit history comparisons.
- Strategies gate orders with `bar_state.is_confirmed` when close-confirmed behavior is intended.
- MTF logic uses `BarmergeLookahead.Off` by default.
- Plots have stable titles, order, and colors.
---
# stdlib
# Navi Standard Library Reference
This file explains **how to find and use** Navi's standard library. It intentionally does not enumerate every function, method, or enum variant — those evolve and live in the authoritative docs.
## Source of Truth
Look up exact names, argument order, parameter qualifiers, and enum variants on navi-lang.org before using them:
- Everything in one file (language guide + full stdlib API):